Figures & data
Table 1. Primers used for real-time qPCR.
Table 2. PDF total energy and DOPE scores of each model.
Figure 1. The 3D structure of the AdipoR1 homology model (A) and the Ramachandran plot of model 1 (B). The zone in the blue line (inside line) was the most favoured region, and the zone in the purple line (outside line) was the allowed region. The zone outside of the purple line was the disallowed region.
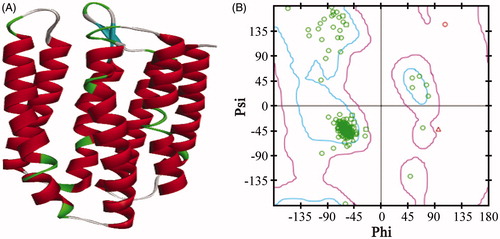
Table 3. Sequence of known active peptides and the docking results to the model 1.
Table 4. Sequence and gold scores of the screened peptides.
Figure 2. The cell proliferation of HSC-T6 and NIH-3T3 cells treated with different concentrations of peptide or PBS. (A) Cell proliferation of HSC-T6 cells. (B) Cell proliferation of NIH-3T3 cells. Statistically different levels are denoted by *p < 0.01, and the data are presented as the mean of three repeated experiments.
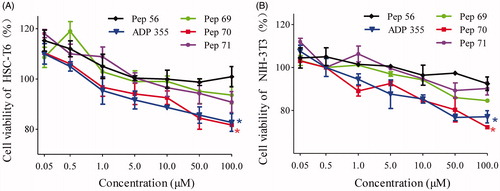
Figure 3. Pep70-induced cell-cycle arrest. Flow cytometric cell-cycle analysis in HSC-T6 and NIH-3T3 cells subjected to different concentrations of peptide treatment under 5 ng/ml rat TGF-β1 stimulation for 24 h. (A) Flow cytometric histograms showing cell distributions in the G0/G1, S and G2/M phases of the cell cycle. (B and C) Quantification of the DNA content in the G0/G1, S and G2/M phases. This study was conducted in duplicate, and the data from one representative experiment are shown.
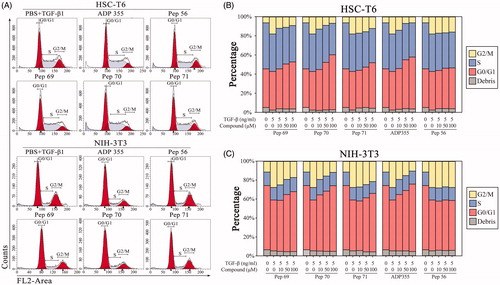
Figure 4. Representative western blot analysis of HSC-T6 (A) and NIH-3T3 (B) cells treated with PBS or 10 μM screened peptides in the presence of 5 ng/ml rat TGF-β1 for 24 h. The protein expression levels of α-SMA, COL1A1 and TGF-β1 were probed. GAPDH served as the loading control, and PBS served as the control (Ctl), while only 5 ng/ml TGF-β1 stimulation served as the model (Model). This experiment was repeated three times under the same conditions, and one representative set of results are presented.
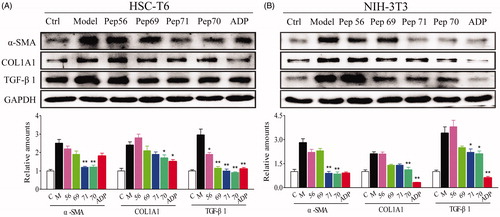
Table 5. The relative mRNA levels of α-SMA, COL1A1 and TGF-β1 in HSC-T6 and NIH-3T3 cells.
Figure 5. (A) Superposition of our homology model of adiponectin receptor 1 (yellow) and the crystal structure of adiponectin receptor 1 (PDB id: 3WXV; grey; 135–355 region). The RMSD between Cα atoms was 6.64 Å. (B) The binding mode of Pep70 docked to the 3WXV. 3WXV is shown as a line representation. Pep70 (purple) and the residues involved in the interaction (yellow) are displayed as a stick representation. Hydrogen bonds are depicted by the green dotted lines. Pi–pi interactions are depicted by the orange solid lines.
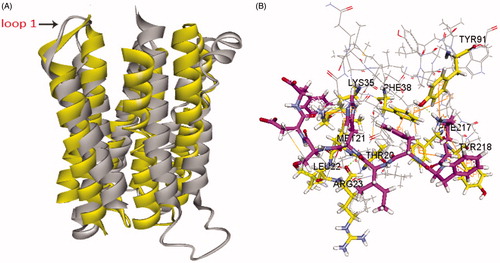
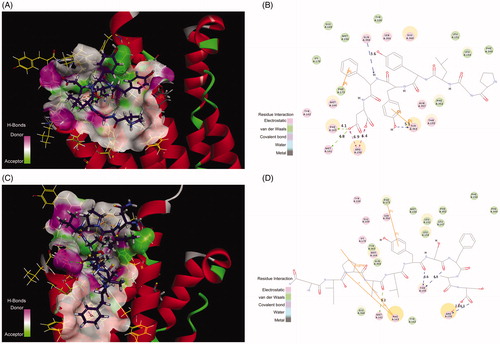
Figure 6. (A) The H-bond interactions between Pep70 and crystal structure 3WVX with the crystal structure of 3WVX shown as a line representation. Pep70 (purple) and the residues involved in the interaction (yellow) are displayed as a stick representation. Hydrogen bonds are depicted by the green dotted lines. Pi–pi interactions are depicted by the orange solid lines. (B) Plot of the interactions between Pep70 and 3WVX. (C) The binding mode of ADP355 to 3WVX. (D) Plot of the interactions between ADP355 and 3WVX.