Figures & data
Figure 1. (a) Concentration–absorbance graph used to calculate SC50, (b) concentration–colour value graph used to calculate CSC50 and (c) 1st degree derivative graph used to calculate CSC50 for protocatechuic acid and ferulic acid standards.
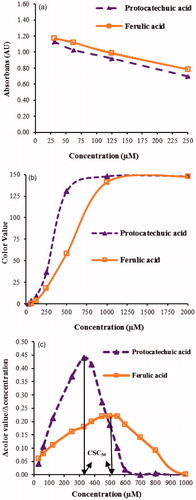
Figure 2. Linearity of SC50 and CSC50 values as a function of DPPH• radical concentration using Trolox standard.
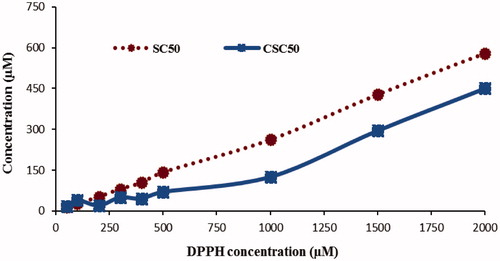
Figure 3. The effect of drop volume on colour value readings using Trolox standard.
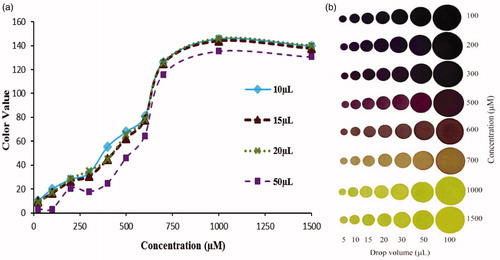
Figure 4. The effect of incubating the reaction mixtures in (a) test tubes and (b) on TLC for 55 min using shringaldehyde as standard, and (c) trends in absorbance decrease as DPPH was scavenged with the standards as a function of time, i.e. reaction kinetics.
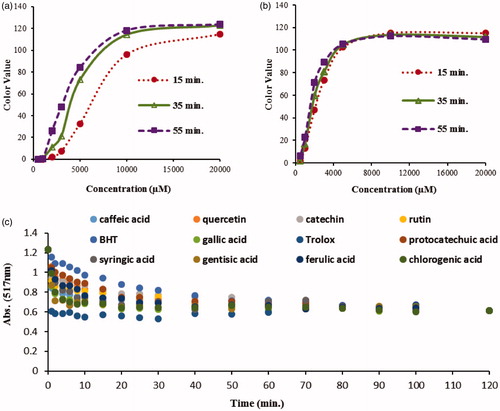
Table 1. Validation parameters of spectrophotometric and the new colorimetric methods.
Table 2. Phenolic components of the plant methanolic extracts.
Figure 5. (a) Image of spots prepared with 1:1 serial dilution of gallic acid beginning from 3000 μg/mL highest concentration, and image of spots prepared with 1:1 serial dilution of alkanet extract beginning from 5000 μg/mL highest concentration containing (b) extract and reagent solvent (methanol) and (c) extract and DPPH• reagent.
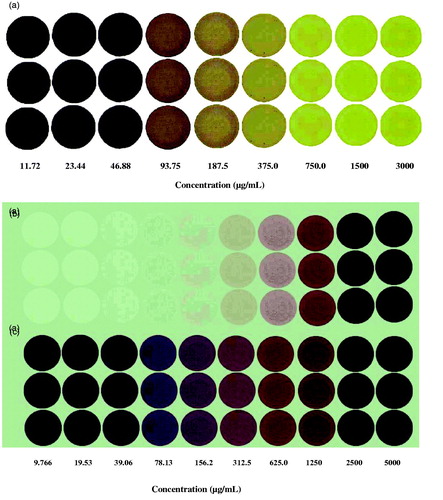
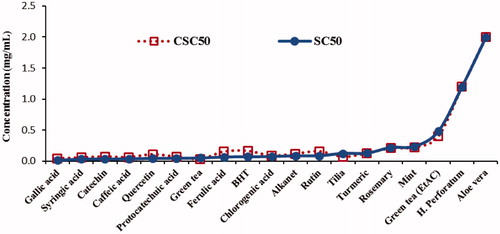
Figure 6. The SC50 and CSC50 values of standards and extracts (showing a good correlation with R2 = 0.9923).