Figures & data
Figure 1. (A) The exosome preparation derived from human macrophage supernatants was stained with anti-CD9 and anti-CD81 antibodies and analyzed by nanoscale-flow cytometry. The double positive events were then analyzed for their size. Relative percentages are shown on plots. CD9+ CD81+ microvesicles of size less than 110 nm were also analyzed by flow cytometer for the acidic content using the BCECF dye. Within total CD81+ CD9+ exosomes population, the median intensity fluorescence (MIF) of BCECF was evaluated to measure the intravesical pH. High MIF value corresponds to high pH. Data are expressed as means ± SD of three independent experiments. (B) Proposed experimental protocol for AO charging on macrophage exosome preparation. (C) Proposed mechanism of AO charged exosome retention.
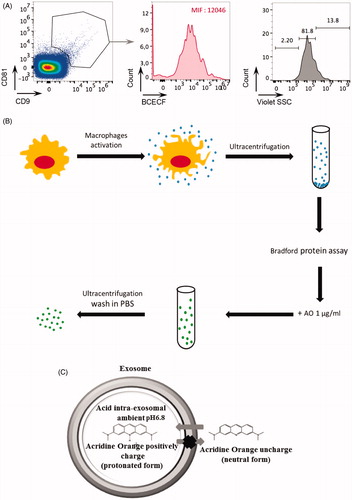
Figure 2. (A) Cytofluorimetry assessment of the potential uptake of 25 μg M ϕ Exo-AO on human melanoma Me 30966 treated for 10 minutes. (B) Cytofluorimetric evaluation of the potential release of M ϕ Exo-AO versus free AO on human melanoma Me 30966 treated for 6 h. Columns, mean percentages of fluorescence intensity of two independent experiments run in triplicate; bars indicate SD. *p < 0.05.
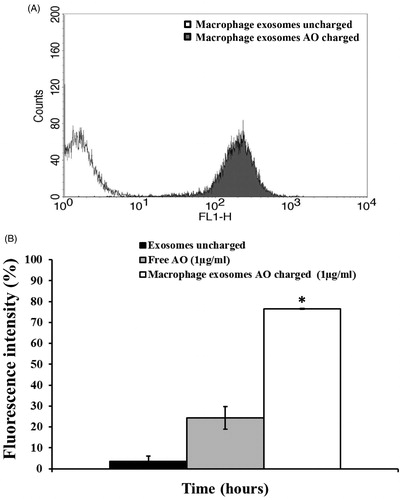
Figure 3. (A) Cytotoxic effect of M ϕ Exo-AO compared to free AO against melanoma cell monolayer by cytofluorimetry assessment. Columns, mean percentages of cell death of two independent experiments run in triplicate; bars indicate SD. *p < 0.05. (B) Fluorescence microscopy showing the formation of membrane "blebs" in melanoma cells treated with M ϕ Exo-AO (1 μg/ml) after five minutes of exposition to blue light.
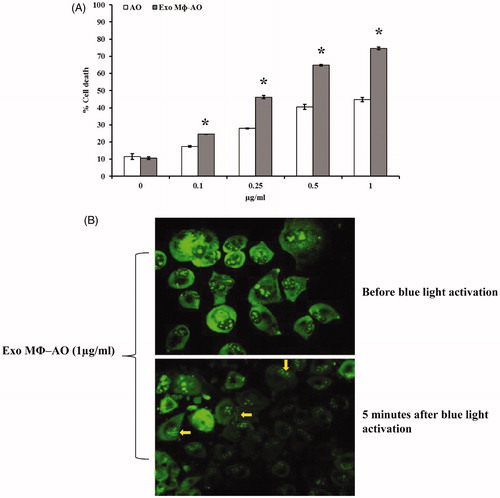
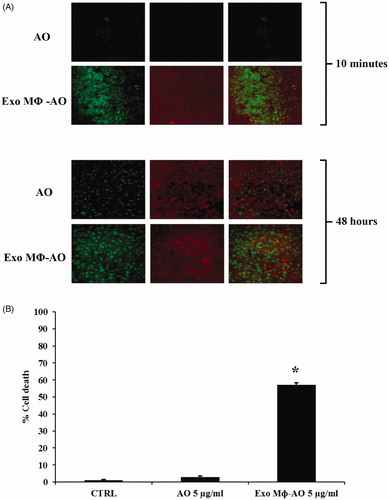
Figure 4. (A) Confocal laser scanning microscopic assessment of release and retention of M ϕ Exo-AO versus free AO in melanoma spheroids at 10 minutes and 48 h of incubation. (B) Cytotoxicity induced in melanoma spheroids by M ϕ Exo-AO versus free AO. Columns, mean percentages of cell death of two independent experiments run in triplicate; bars indicate SD. *p < 0.05.