Figures & data
Figure 1. Structure of inhibitor 1 (left panel) and its bound conformation in the active site of the WNV NS2B-NS3 protease (right panel, PDB: 2YOLCitation19). Intermolecular polar contacts between enzyme and inhibitor are shown as dashed lines in black, the intramolecular contact stabilizing the horseshoe-like inhibitor conformation is shown in green.
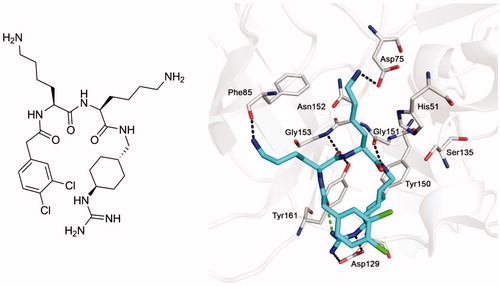
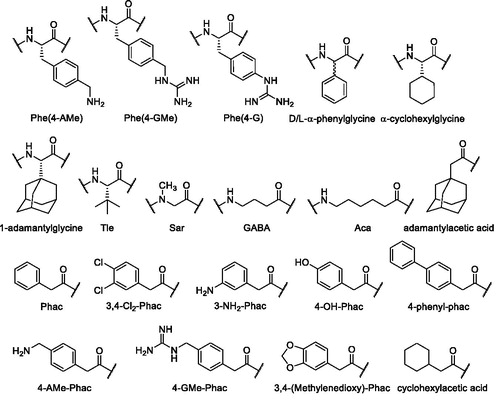
Figure 2. Structures and used abbreviations of unusual amino acids and acyl residues.
Scheme 1. Synthesis of inhibitors 3 and 9. HPLC analysis, used for monitoring the reactions, started at 10% solvent B. (a) Loading of 2-chlorotrityl chloride resin, Fmoc-Lys(Boc)-OH, 4 equiv. DIPEA in dry DCM, 2 h; (b) Manual Fmoc SPPS with 3 equiv. Fmoc-Phe(4-Tfa-AMe)-OH or phenylacetic acid, 3 equiv. HBTU and 6 equiv. DIPEA; Fmoc removal with 20% piperidine in DMF; (c) 1% TFA in DCM, 3 × 30 min; (d) 1 equiv. trans-1-(Cbz-amino)-4-aminomethyl-cyclohexane × HCl, 1 equiv. PyBOP, 3 equiv. DIPEA, DMF; (e) H2 and Pd/C as a catalyst in 90% acetic acid, stirring overnight at r.t.; (f) 3–6 equiv. 1H-pyrazole-1-carboxamidine × HCl, 4 equiv. DIPEA in DMF, 16 h; (g) 1 M NaOH in dioxane/water, pH 12 at r.t. 3 h, neutralization by 10% TFA; (h) 90% TFA, at r.t. 1 h, preparative HPLC. All HPLC measurements of intermediates started at 10% solvent B, the analysis of the more hydrophilic final inhibitors 3 and 9 started at 1% solvent B.
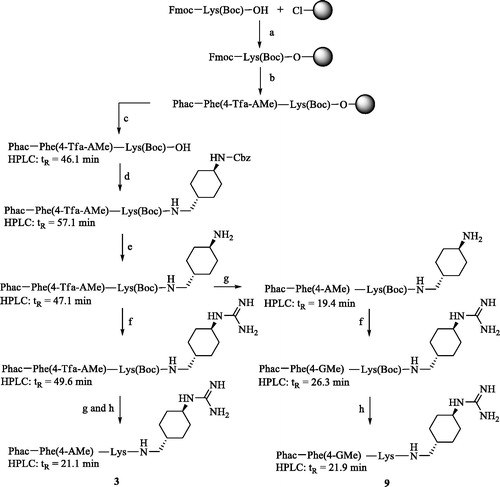
Table 1. Analytical data and inhibition of the WNV and DENV NS2B-NS3 proteases by inhibitors of the formula.
Table 3. Chimeric furin, WNV and DENV-2 NS2B-NS3 protease inhibitors of the formula.
Figure 3. Dixon plot for the inhibition of the WNV NS2B-NS3 protease by inhibitor 37. Kinetic measurements have been performed with three different concentrations of the substrate Phac-Leu-Lys-Lys-Arg-AMC at 100 (•), 50 (^), and 25 μM (▾) using various inhibitor concentrations. The dashed line represents 1/Vmax, which was obtained from a Michaelis–Menten plot determined in parallel on the same 96-well plate.
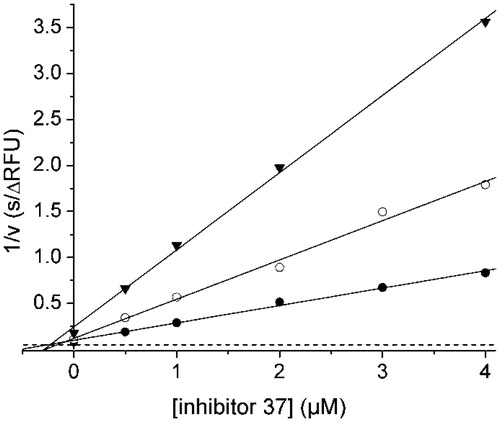
Table 2. Analytical data and inhibition of the WNV and DENV NS2B-NS3 protease by peptides of the formula P4-Lys-Lys-Arg-R′ (HPLC measurements started at 1% solvent B).
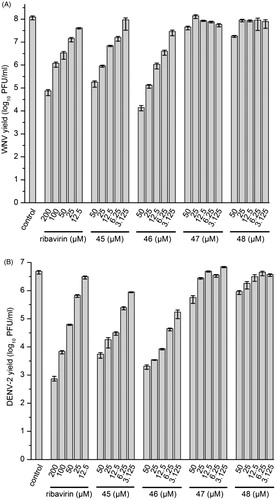
Figure 4. Reduction of WNV (A) and DENV-2 (B) propagation by inhibitors 45–48. The number of formed infectious viruses (virus yield ± standard deviation, n = 3) was determined at 48 h postinfection from the supernatant of infected cells by a plaque assay. The nucleoside analog ribavirin was used as a reference.