Figures & data
Figure 1. Reported sulfonamide derivatives that are CA-IX selective agents. (A) Trimeric AmBF3-(AEBS)3 and AmBF3-(ABS)3, (B) Ga-DOTA-AEBSA, and (C) cationic sulfonamide derivatives.
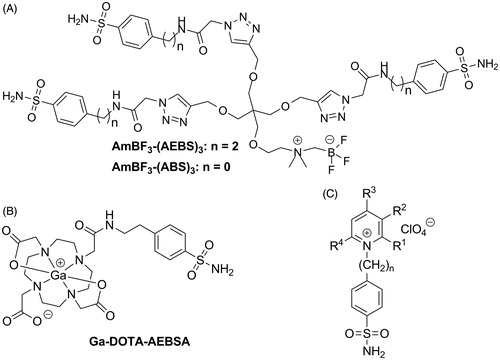
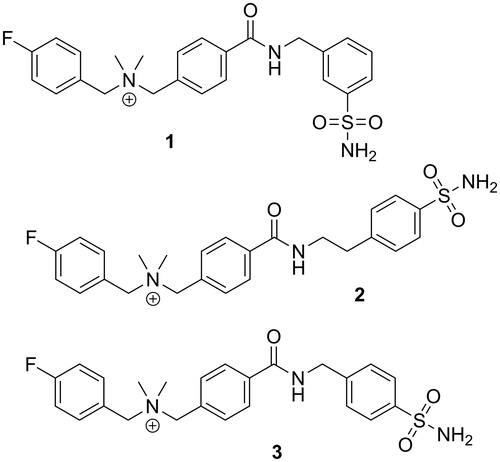
Figure 2. Chemical structures of three cationic carbonic anhydrase IX inhibitors evaluated in this study.
Scheme 1. Synthesis of cationic carbonic anhydrase IX inhibitors 1–3.
Table 1. Inhibition constants (Ki) of cationic inhibitors 1–3 to carbonic anhydrases I, II, IV, and IX as determined by a stopped-flow CO2 hydration assay. Errors in the range of 5–10% of the reported value from three different assays.
Scheme 2. (A) Synthesis of the radiolabeling precursor 8. (B) Synthesis of 18F-labeled 2.
Figure 3. HPLC chromatograms of 18F-labeled 2 from (A) QC sample, or plasma sample after being incubated at 37 °C for (B) 5 min, (C) 15 min, or (D) 60 min.
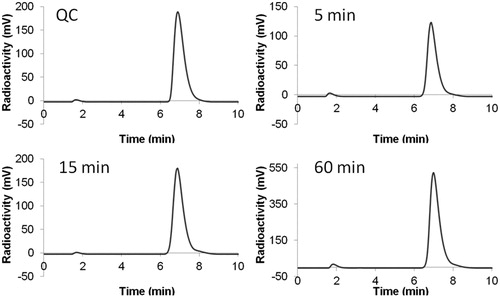
Figure 4. Biodistribution of 18F-labeled 2 at 1 h post-injection in HT-29 tumor-bearing mice. Values (%ID/g) are presented as mean ± standard deviation (n = 5).
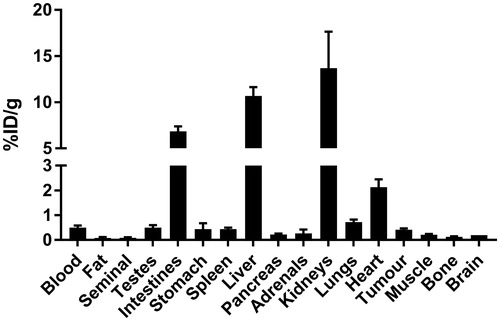
Figure 5. Representative PET and CT images acquired at 1 h post-injection with 18 F-labeled 2 in HT-29 colorectal cancer xenograft-bearing mice. Arrow indicates location of tumor.
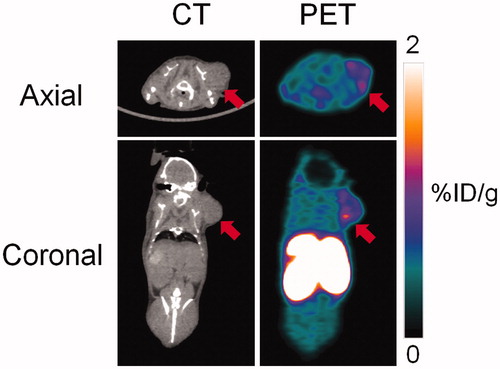
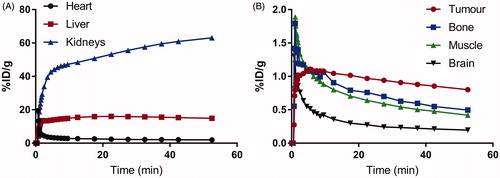
Figure 6. Time activity curves for 18F-labeled 2 using ROIs drawn around high activity organs (A) heart, liver, and kidneys, and low activity organs (B) tumor, bone, muscle, and muscle.