Figures & data
Scheme 1. Synthesis way for target compounds (6a–6m).
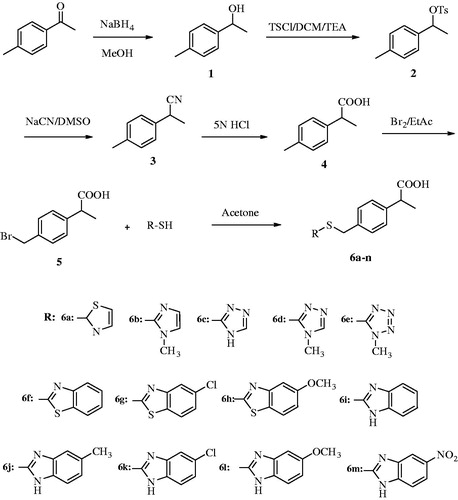
Table 1. IC50 (μM) values of the compounds 4, 6a–6m and reference drugs against COX-1 and COX-2 enzymes.
Figure 1. (a) Lineweaver–Burk plots for the inhibition of COX-1 enzyme by compound 6h. [S], substrate concentration (mM); V, reaction velocity (nmol/min/mg protein). Inhibitor concentrations are shown at the left. Km values from 4 × IC50 to Control; 0.070, 0.048, 0.036, 0.029, 0.021 and 0.014 (mM). Vmax value of the competitive inhibition; 0.830 ± 0.011 (nmol/min/mg protein). (b) Secondary plot for calculation of steady-state inhibition constant (Ki) of compound 6h. Ki was calculated as 2.07 μM.
![Figure 1. (a) Lineweaver–Burk plots for the inhibition of COX-1 enzyme by compound 6h. [S], substrate concentration (mM); V, reaction velocity (nmol/min/mg protein). Inhibitor concentrations are shown at the left. Km values from 4 × IC50 to Control; 0.070, 0.048, 0.036, 0.029, 0.021 and 0.014 (mM). Vmax value of the competitive inhibition; 0.830 ± 0.011 (nmol/min/mg protein). (b) Secondary plot for calculation of steady-state inhibition constant (Ki) of compound 6h. Ki was calculated as 2.07 μM.](/cms/asset/0d70a70a-dcc3-42f3-8b85-cda6a92cac84/ienz_a_1310726_f0001_b.jpg)
Figure 2. (a) Lineweaver–Burk plots for the inhibition of COX-1 enzyme by compound 6l. [S], substrate concentration (mM); V, reaction velocity (nmol/min/mg protein). Inhibitor concentrations are shown at the left. Km values from 4 × IC50 to Control; 0.064, 0.043, 0.030, 0.025, 0.017 and 0.013 (mM). Vmax value of the competitive inhibition; 0.669 ± 0.003 (nmol/min/mg protein). (b) Secondary plot for calculation of steady-state inhibition constant (Ki) of compound 6l. Ki was calculated as 1.70 μM.
![Figure 2. (a) Lineweaver–Burk plots for the inhibition of COX-1 enzyme by compound 6l. [S], substrate concentration (mM); V, reaction velocity (nmol/min/mg protein). Inhibitor concentrations are shown at the left. Km values from 4 × IC50 to Control; 0.064, 0.043, 0.030, 0.025, 0.017 and 0.013 (mM). Vmax value of the competitive inhibition; 0.669 ± 0.003 (nmol/min/mg protein). (b) Secondary plot for calculation of steady-state inhibition constant (Ki) of compound 6l. Ki was calculated as 1.70 μM.](/cms/asset/26f642e6-56dd-4e9a-9ece-3bcebf875b01/ienz_a_1310726_f0002_b.jpg)
Table 2. Antimicrobial activity (MIC μg/mL) of compounds 4, 6a–6m and reference drugs against pathogenic microorganisms.
Table 3. IC50 (μM) values of the ibuprofen. nimesulide and the compounds 6h and 6l against NIH/3T3 cell line.
Table 4. The AMESMPF results of the compounds.
Figure 3. Dose-response curve of compound 6h against TA98 and TA100 in the presence and absence of S9 according to AMESMPF test.
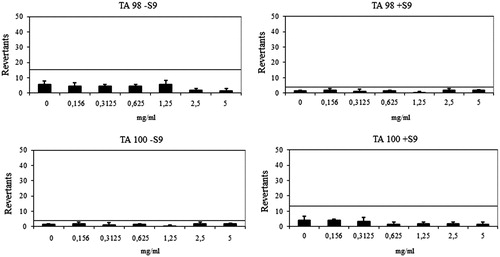
Figure 4. Dose–response curve of compound 6l against TA98 and TA100 in the presence and absence of S9 according to AMESMPF test.
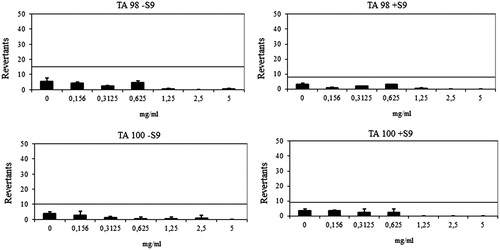
Table 5. In silico physicochemical parameters of the compounds 6a–6m.
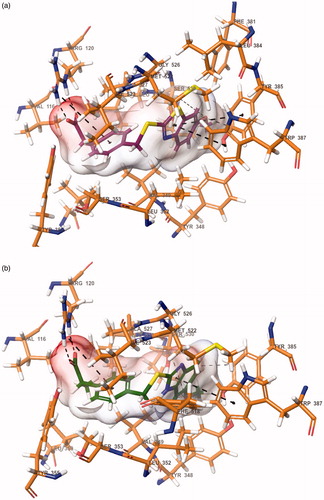
Figure 5. The binding site of COX-1 containing compound 6h (a) and 6l (b). The interacting side chain amino acid residues are shown in sticks style.