Figures & data
Figure 1. SDS–PAGE of the recombinant SspCA expressed and purified from E. coli. Lane STD, molecular markers, M.W. starting from the top: 250, 150, 100, 75, 50, 37, 25, 20 kDa; Lane 1, SspCA after thermoprecipitation at 70 °C and centrifugation; Lane 2, purified SspCA from His-tag affinity column.
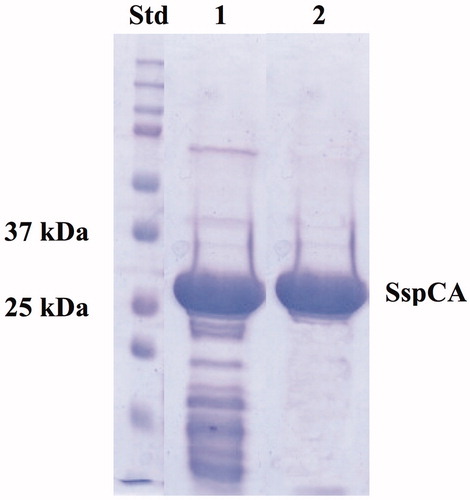
Figure 2. Schematic representation of the crosslinked carbonic anhydrase (CA) and magnetic nanoparticles (MNP) incorporating NH2 moieties obtained by reaction of hydrated magnetite with concentrated ammonia solution. The OH from magnetite may also be derivatised in a similar manner with formation of ester linkages.
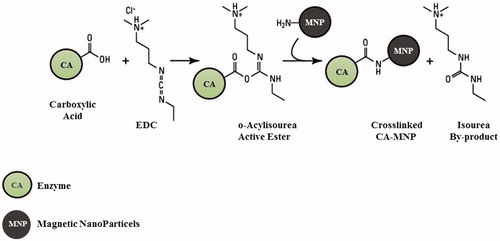
Figure 3. Binding of SspCA to MNPs. The amount of SspCA bound to 250 mg of Fe3O4 increased up to about 12 mg of enzyme. Measurements have been done determining the unbound SspCA in the supernatant after the binding process. Each point was the mean of three independent determinations. All data was analyzed by means of GraphPad Prism 5.0 software (GraphPad Software, San Diego, CA).
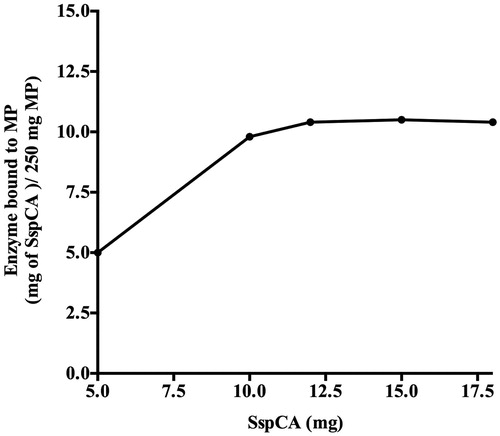
Figure 4. Temperature stability of the free and bound CAs (SspCA and bCA). Panel A and B: temperature stability at 50 °C; Panel C and D: temperature stability at 70 °C. Continuous line: bound SspCA or bCA; Dashed line: unbound SspCA or bCA. Each point is the mean of three independent determinations.
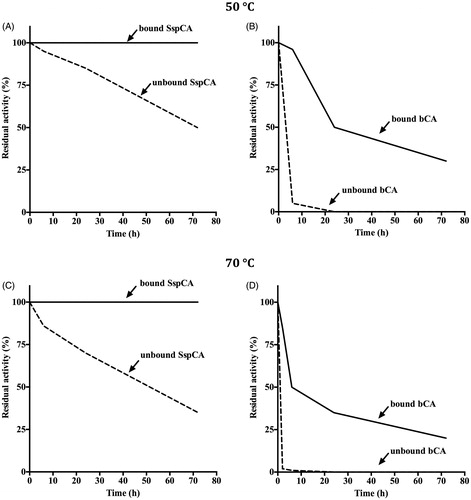
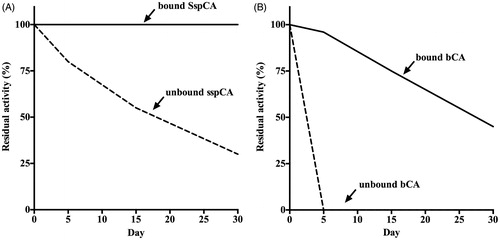
Figure 5. Long-term stability of the free and bound CAs (SspCA and bCA). Long-term stability was performed at 25 °C measuring the residual activity of the free and bound SspCA and bCA at the days indicated on the x-axis. Legend: Panel A: free and bound SspCA. Panel B: free and bound bCA. Continuous line: bound SspCA or bCA; Dashed line: unbound SspCA or bCA. Each point is the mean of three independent determinations.