Figures & data
Figure 1. HNE inhibitors.
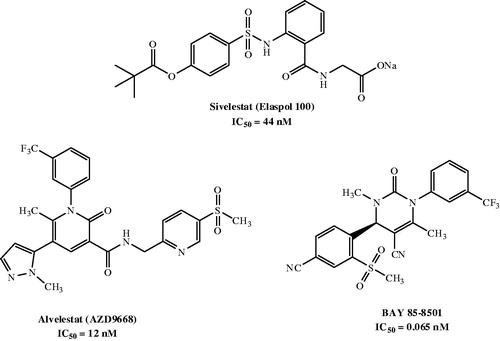
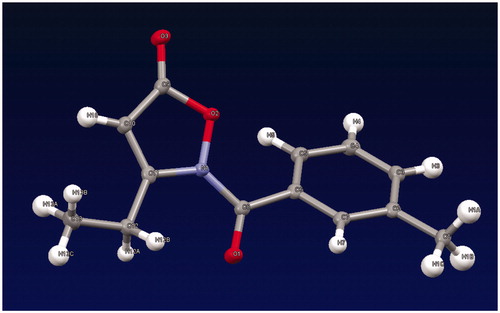
Figure 2. X-ray structure of compound 2j.
Scheme 1. Reagents and conditions: (a) R2-COCl, NaH, anhydrous THF, r.t., 24 h; (b) Lawesson’s reagent, toluene, reflux, 5 h; (c) for 4a,b: 3-methylbenzyl chloride, K2CO3, anhydrous CH3CN, 80 °C, 2 h; for 4c: 3-methylphenyl boronic acid, (CH3COO)2Cu, Et3N, anhydrous CH2Cl2, r.t., 24 h.
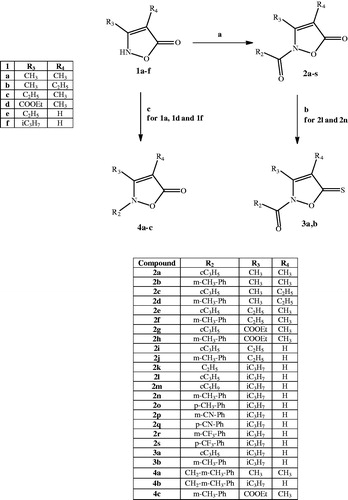
Table 1. HNE inhibitory activity of isoxazolone derivatives 2a–s, 3a,b, 4a–c.
Table 2. Biological activities, geometric parameters, and docking scores of the enzyme–inhibitor complexes predicted by molecular docking with MVD.
Figure 3. Docking poses of compounds 2n (lower compound) and 3b (upper compound). The ovals represent the C=S and C=O fragment of the two compounds, respectively. Residues within 6 Å from the co-crystallized ligand are shown.
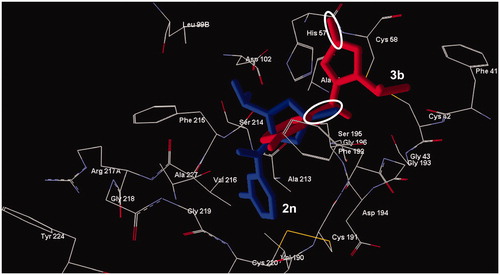
Figure 4. Docking pose of compound 2o. Residues within 3 Å of the pose are visible. The H-bond is shown by a dashed line and is indicated by the arrow.
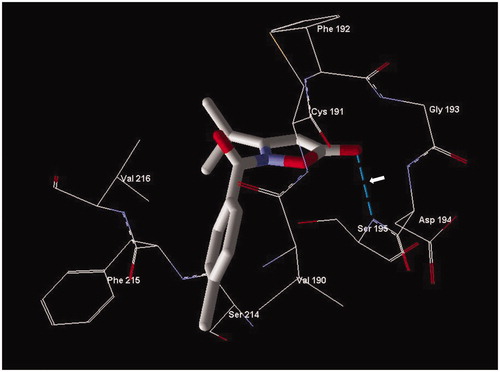
Figure 5. Analysis of compound 2i spontaneous hydrolysis. Compound 2i (80 μM) was incubated in 0.05 M phosphate buffer (pH 7.5, 25 °C) supplemented with 0, 50, 200, and 400 μg/ml HNE, as indicated. Spontaneous hydrolysis was monitored by measuring changes in absorbance at 275 nm (absorption maximum of compound 2i) over time. The data are presented as the mean ± SD of triplicate samples from one experiment, which is representative of two independent experiments.
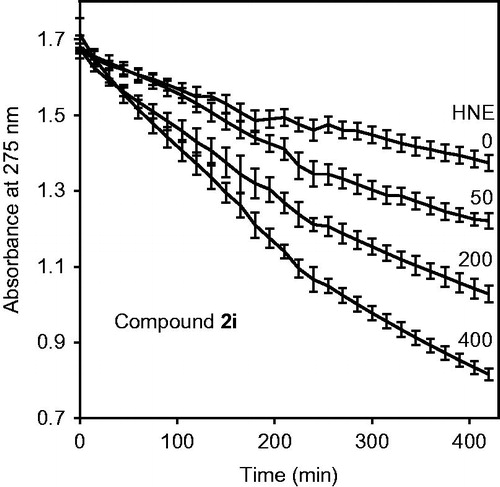
Table 3. Half-life (t1/2) for the hydrolysis of selected isoxazolone derivatives in aqueous buffer and in the presence of HNE.
Figure 6. Evaluation of HNE inhibition by selected isoxazolone derivatives. HNE was incubated with the indicated compounds at 5 μM concentrations, and kinetic curves monitoring substrate cleavage catalysed by HNE are shown. Representative curves are from three independent experiments.
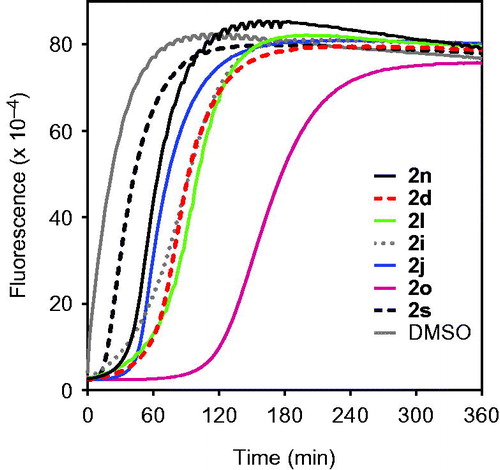
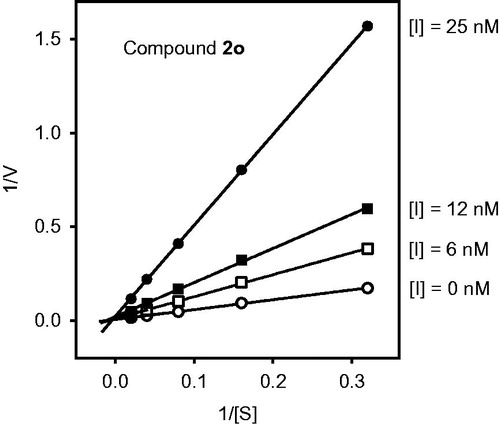
Figure 7. Kinetics of HNE inhibition by compound 2o. Representative double-reciprocal Lineweaver–Burk plot from three independent experiments.