Figures & data
Figure 1. Chemical structures of the compounds used in the study: The DTCs Fc14–584B and Fc14–494 A are a new class of potent β-CA inhibitors that bind the zinc ion from the enzyme active site in monodentate manner. Both enzymes were inhibited with efficacies between the subnanomolar to the micromolar range (Ki =0.94–893 nM), depending on the substitution pattern at the nitrogen atom from the dithiocarbamate zinc-binding group.Citation13
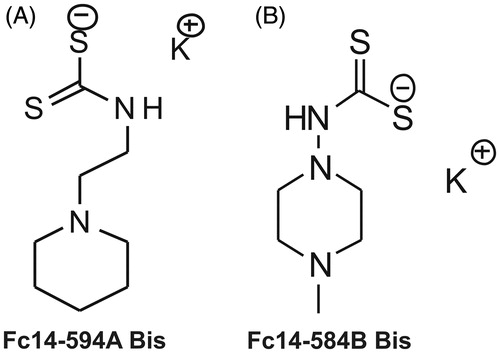
Figure 2. Expression analysis of β-CAs from M. marinum: (A) The qualitative expression analysis of three β-CA genes using PCR showed presence of all the three β-CAs in M. marinum strain ATCC 927 which was used for in vivo infection and drug treatment studies. Thermo Scientific GeneRuler 1 kb DNA Ladder was used as marker. Genomic DNA was used as positive control. The test samples used were cDNAs for the analysis of expression of β-CAs from M. marinum. (B–D) Relative expression analysis of three β-CA genes from three M. marinum strains using RT-qPCR according to the Pfaffl method.Citation24
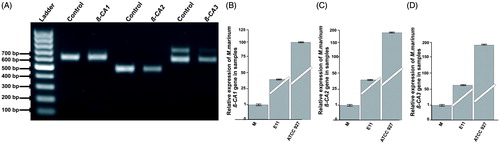
Figure 3. Evolutionary relationship of the β-CAs from M. marinum and M. tuberculosis. The phylogenetic analysis of all three β-CAs from both bacterial species showed that the β-CA sequences are evolutionarily closely related.
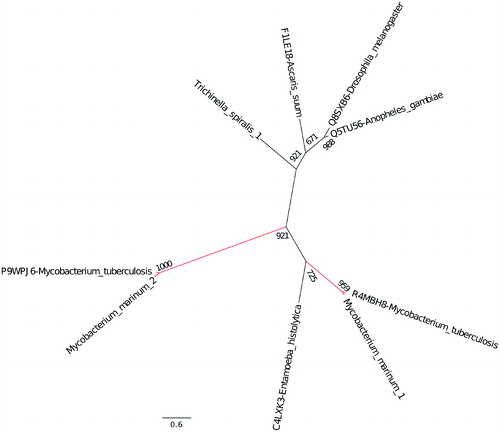
Figure 4. Effects of dithiocarbamates Fc14–594 A and Fc14–584B on developing embryos. Developmental images of 1–5 dpf embryos exposed to different concentrations of Fc14–594 A and Fc14–584B β-CA inhibitor compounds. (A) Row shows the images of control group embryos (not treated with inhibitors) with normal embryonic development. (B) Row shows the images of zebrafish embryos exposed to Fc14–594 A. The embryos exposed to 20 μM concentration of Fc14–594 A showed short and curved body structure with mild edema (arrows), curved tail (bullet), and unutilized yolk sac (arrow head) and the embryos exposed to 30 μM Fc14–594 A did not survive beyond 3 dpf. (C) Row shows the images of embryos exposed to Fc14–584B. The embryos exposed to concentrations up to 300 μM of Fc14–584B generally had a normal embryonic development with no significant phenotypic defects. The embryos exposed to 600 μM of Fc14–584B did not survive beyond 3 dpf.
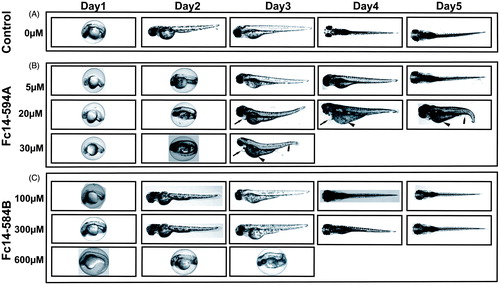
Figure 5. LC50 determination of the two compounds: The LC50 dose for the drugs, Fc14–584B and Fc14–594 A was determined based on cumulative mortality of 5 days after the exposure of embryos to the different concentration of the drugs. The LC50 were determined after three independent experiments with similar experimental conditions (n = 30).
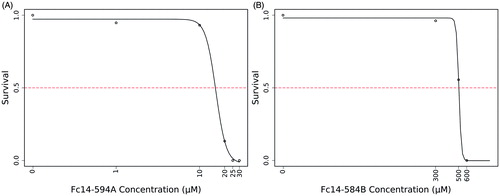
Figure 6. Effect of dithiocarbamate Fc14–584B on phenotypic parameters of the developing zebrafish embryos. The effect of 300 and 500 μM concentrations of Fc14–584B on survival, movement, yolk sack, hatching, heartbeat, body shape, and edema of the zebrafish embryos was recorded 1–5 dpf. For each concentration, n = 30. *p < .05 by two-tailed Fisher’s test.
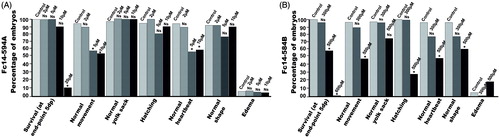
Figure 7. Dithiocarbamates Fc14–584B and Fc14–594 A inhibit the growth of M. marinum. MIC was determined in liquid cultures by visual inspection and turbidity measurement in two separate experiments (AB and CD). In both experiments n = 6. p values in the pictures are two-tailed t-test values of comparisons to 0 μM.
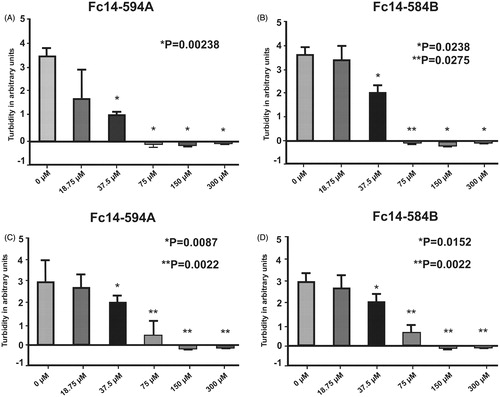
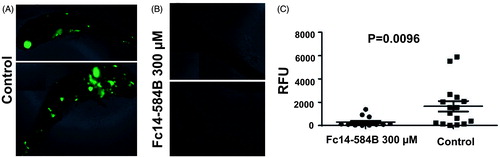
Figure 8. Dithiocarbamate Fc14–584B inhibits the growth of M. marinum in vivo in zebrafish larvae. Zebrafish larvae were infected with green fluorescent M. marinum wasabi strain with an average infection dose of 471 ± 143 bacteria and were analyzed at 6 dpi. Prior to fluorescence measurement with a plate reader, the fish were checked under a fluorescence microscope to ensure successful infection based on general bacterial fluorescence in the control group. Representative images of typical outcomes of infection 6 dpi (A) without treatment (B) with 300 μM of Fc14–584B. (C) For quantification, the end-point bacterial load was assessed in a fluorometric measurement of bacteria inside transparent fish larvae. The median relative fluorescence units (RFU) value of the group is shown as a horizontal line (ntreated=15, ncontrol=16). The result is a representative of three separate experiments.