Figures & data
Figure 1. Chemical structures of 5-MAPB, bk-2C-B and AMT.
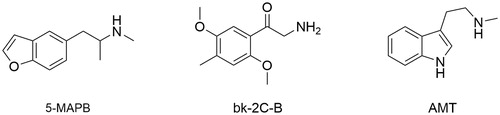
Figure 2. Picture of the seized material.
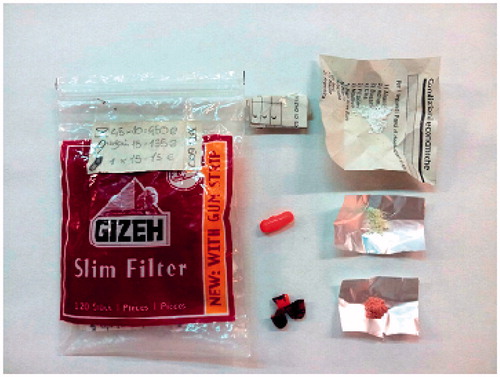
Figure 3. GC–MS chromatogram of the white powder and mass spectrum of 5-MAPB.
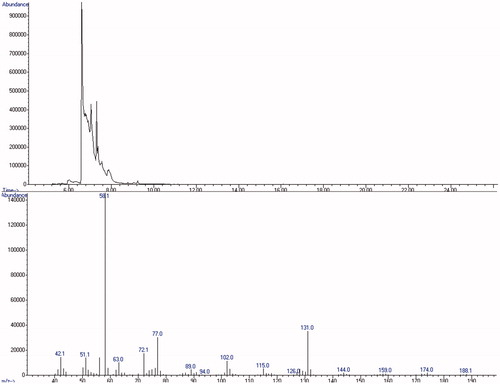
Figure 4. LC–MS/MS chromatogram of the white powder and merged mass spectrum (CE: 10 and 20 eV) of 5-MAPB.
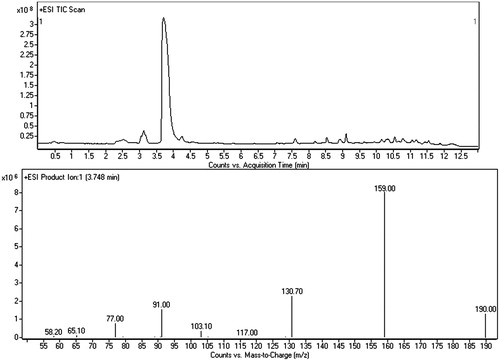
Figure 5. GC–MS chromatogram of the yellow powder and mass spectrum of bk-2C-B.
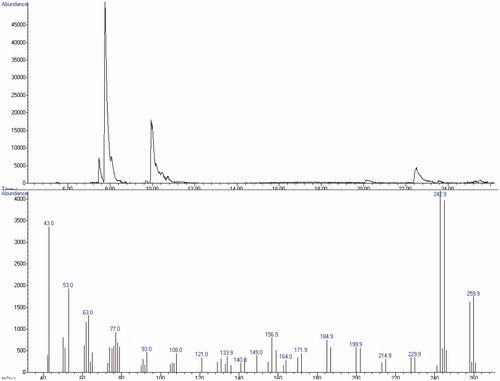
Figure 6. LC–MS/MS chromatogram of the yellow powder and merged mass spectrum (CE: 10 and 20 eV) of bk-2C-B.
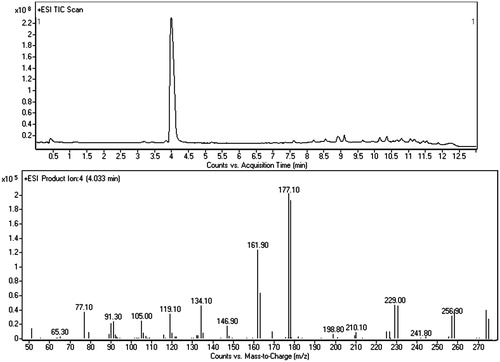
Figure 7. GC–MS chromatogram of the grey/red powder.
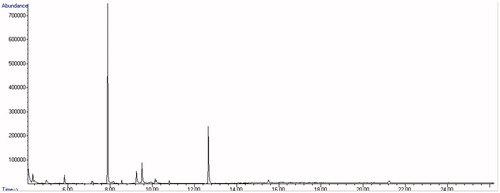
Figure 8. LC–MS/MS chromatogram of the grey/red powder and merged mass spectrum (CE: 10 and 20 eV) of AMT.
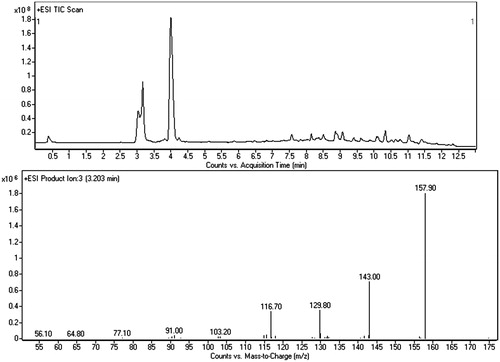
Figure 9. Chemical structure and numbering of 1-(benzofuran-5-yl)-N-methylpropan-2-ammonium ion (5-MAPB).
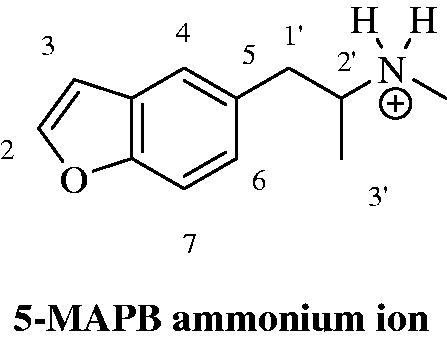
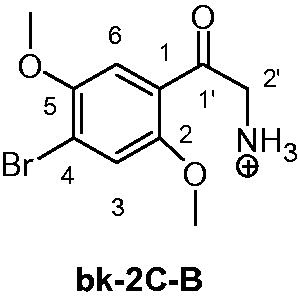
Figure 10. Chemical structure and numbering of 2′-ammonium-1-(4-bromo-2,5-dimethoxyphenyl)ethan-1-one (bk-2C-B).