Figures & data
Figure 1. Structures of selective MAO-B inhibitors.
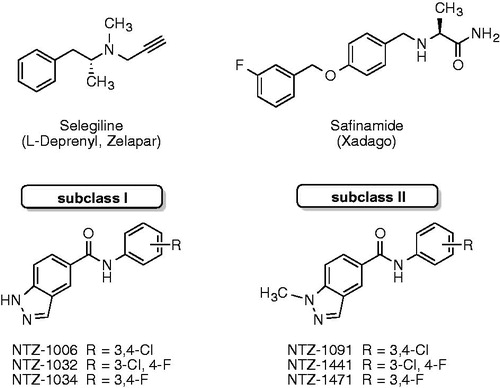
Table 1. MAO inhibitory activity and HYDE estimated affinities against hMAO-B.
Figure 2. (A) SeeSAR visualisation of the binding of NTZ-1006 (blue) and NTZ-1091 (off-white) overlaid onto the crystal structure of the hMAO-B-safinamide complex (PDB: 2V5Z). HYDE visual affinity assessment: green = favourable, red = unfavourable and non-coloured = not relevant for affinity. (B) Bar diagrams representing a semi-quantitative decomposition of enthalpic (ΔH: sum of interactions) and entropic part (−TΔS: sum of desolvation terms) for all heavy atoms of the Gibbs free energy (ΔG, kJ/mol) of tested compounds in comparison to the reference MAO-B inhibitor safinamide (SAF).
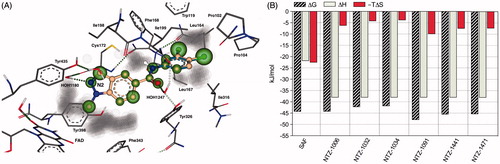
Figure 3. (A) Reactivation of recombinant human MAO-B enzyme by irreversible inhibitor selegiline (30 nM), reversible inhibitor safinamide (50 nM), and representative compounds NTZ-1006 (1.0 nM) and NTZ-1091 (1.0 nM). (B) Lineweaver–Burk plot of the inhibition of hMAO-B enzyme in the absence (no inhibitor) and in the presence of different concentrations (0.5 and 1.0 nM) of NTZ-1091. The reciprocal hMAO-B inhibitory activity of the compound was plotted versus the reciprocal substrate concentration. 1/V: 1/velocity of reaction [1/(nmol p-tyramine/min/mg protein)]; 1/[S]: 1/substrate concentration (1/mM p-tyramine).
![Figure 3. (A) Reactivation of recombinant human MAO-B enzyme by irreversible inhibitor selegiline (30 nM), reversible inhibitor safinamide (50 nM), and representative compounds NTZ-1006 (1.0 nM) and NTZ-1091 (1.0 nM). (B) Lineweaver–Burk plot of the inhibition of hMAO-B enzyme in the absence (no inhibitor) and in the presence of different concentrations (0.5 and 1.0 nM) of NTZ-1091. The reciprocal hMAO-B inhibitory activity of the compound was plotted versus the reciprocal substrate concentration. 1/V: 1/velocity of reaction [1/(nmol p-tyramine/min/mg protein)]; 1/[S]: 1/substrate concentration (1/mM p-tyramine).](/cms/asset/0aa191b9-80a4-4431-a678-a47f1a2f20ad/ienz_a_1344980_f0003_b.jpg)
Table 2. Physicochemical, drug-like, and in vitro ADME properties of investigated and reference MAO-B inhibitors.
Figure 4. (A) HPLC chromatogram of a standard 1.0 mM equimolar mixture of compounds NTZ-1471 (a, ret. time 7.52 min), NTZ-1441 (b, ret. time 8.25 min) and NTZ-1091 (c, ret. time 9.17 min) in methanol (MeOH). Conditions: 40% methanol mobile phase, 10 μL sample injection volume, and 250 μL/min flow rate. (B) Mean solubility of the compounds in pure water and 50% methanol measured by LC/ESI-MS method. (C) Distribution of BBB mean permeability of standard drugs and subclass II compounds measured in the PAMPA assay.
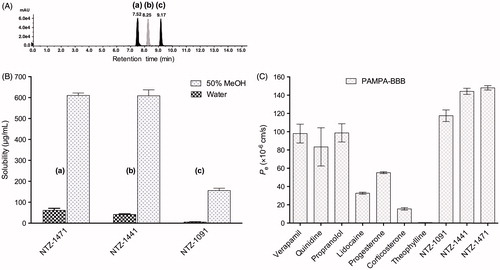
Table 3. Solubility and PAMPA-BBB data for selected compounds.
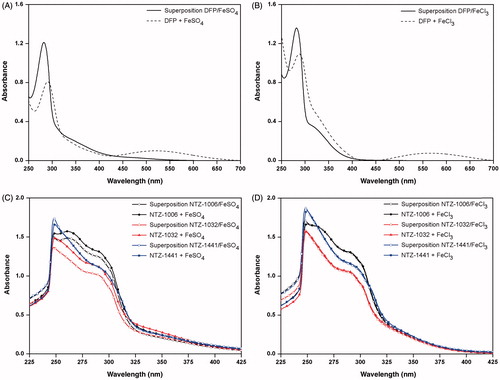
Figure 5. UV–visible studies of Fe2+ or Fe3+ chelating ability of deferiprone (DFP) in the absence or presence of 10 mM FeSO4 (A) and FeCl3 (B) and compounds NTZ-1006 (black line), NTZ-1032 (red line), and NTZ-1441 (blue line) before and after addition of 40 μL of 10 mM FeSO4 (C), or FeCl3 (D). Superposition UV–visible spectra were obtained by measurement of absorbance of compound alone (50 μM) and FeSO4 or FeCl3 without compound (both 130 μM) in DMSO 50%.