Figures & data
Figure 1. Representative examples of coumarin molecules with 1,2,4-triazoles moieties that exhibit anticancer activity.
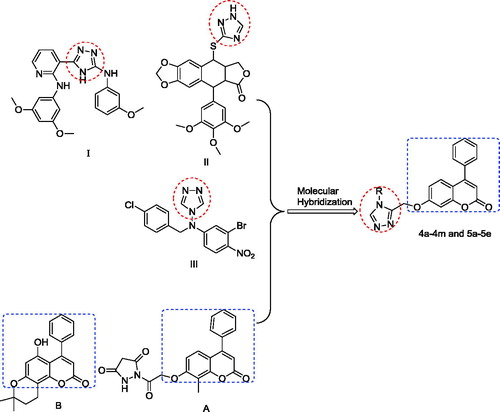
Table 1. In vitro anticancer activity of 1a, its derivatives, and 5-fluorouracil against six cancer cell linesTable Footnotea (IC50 μMTable Footnoteb).
Scheme 1. Reagents and conditions: (a) perchloric acid, rt; (b) K2CO3, ethyl bromoacetate, acetone, 56 °C; (c) hydrazine hydrate, ethyl alcohol, 78 °C; (d) (i) dimethylacetal, acetonitrile, 60 °C, 1 h; (ii) amines, glacial acetic acid, 120 °C; (e) K2CO3, propargyl bromide, acetone, 56 °C; (f) aromatic azides, CuSO4.5H2O, sodium ascorbate, t-BuOH/H2O (1:1), rt.
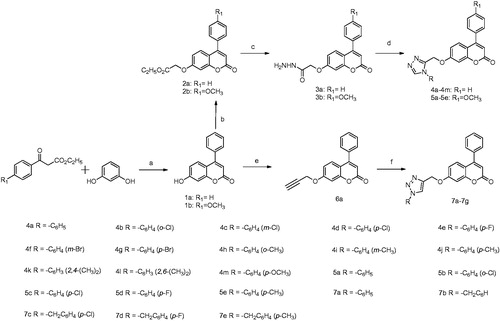
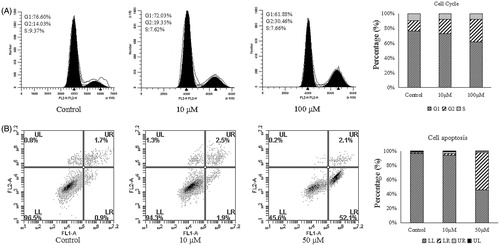
Figure 2. (A) Flow cytometry analyses of cell cycle distribution of gastric cancer cell AGS after treatment of compound 4d (10 and 5 μM) and no treatment (Ctrl) as reference control for 12 h. (B) Apoptosis induction in lung carcinoma cell AGS after 12 h treatment with 4d (10 and 50 μM) and no treatment.