
Figures & data
Table 1. Conversion yields (%) of acylated flavonoid derivatives with monocarboxylic acids (hexanoic, octanoic, decanoic, lauric, and oleic acids).
Figure 1. Xanthine oxidase inhibition (XOI %) by different untreated flavonoids and their acylated derivatives at 45 μM using 250 μM of xanthine substrate. *p < .05, **p < .01 compared with similar untreated flavonoid.
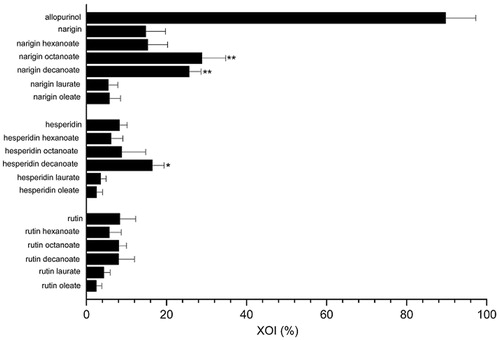
Figure 2. XO inhibition kinetics using Michaelis–Menten curve and Lineweaver–Burk double reciprocal plots for hesperidin decanoate (A), naringin octanoate (B), and naringin decanoate (C) at 45 and 90 μM.
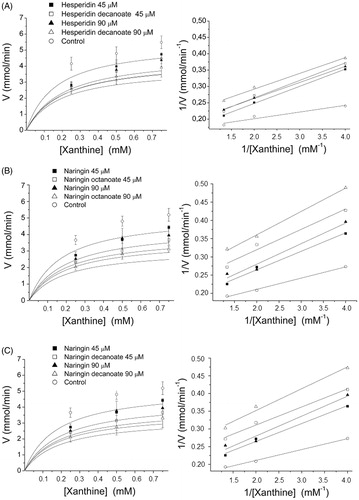
Table 2. Kinetic parameters of the enzymatic reaction catalysed by xanthine oxidase in the absence (control) and presence of the inhibitors (45 and 90 μM).
Figure 3. Effect of concentrations of untreated flavonoids and acylated derivatives on xanthine oxidase inhibition (XOI %).
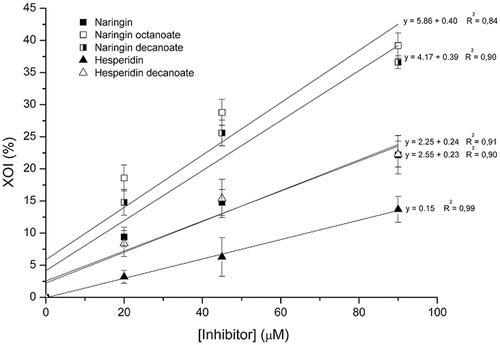
Table 3. IC50 (μM) of untreated flavonoids and acylated derivatives.
Table 4. Partition coefficient in octan-1-ol/water (k) of untreated flavonoids and their acylated derivatives.