Figures & data
Figure 1. (A) Cryosection and (B) H.E. staining of appendix role. (C–F) Representative images of control, AQP1 negative, AQP1 mildly positive and strongly positive immunohistochemical staining (10× standard microscopic enlargement) (G) Consecutive pictures of tip and base were taken (10× standard microscopic enlargement) and AQP1 positive ganglia were counted (H) Immunofluorescence co-staining revealed different expression patterns for AQP1 and MAP2 (40x standard microscopic enlargement).
![Figure 1. (A) Cryosection and (B) H.E. staining of appendix role. (C–F) Representative images of control, AQP1 negative, AQP1 mildly positive and strongly positive immunohistochemical staining (10× standard microscopic enlargement) (G) Consecutive pictures of tip and base were taken (10× standard microscopic enlargement) and AQP1 positive ganglia were counted (H) Immunofluorescence co-staining revealed different expression patterns for AQP1 and MAP2 (40x standard microscopic enlargement).](/cms/asset/c14a3d7b-6bc5-49e9-b3bd-56127caf90cb/ienz_a_1347167_f0001_c.jpg)
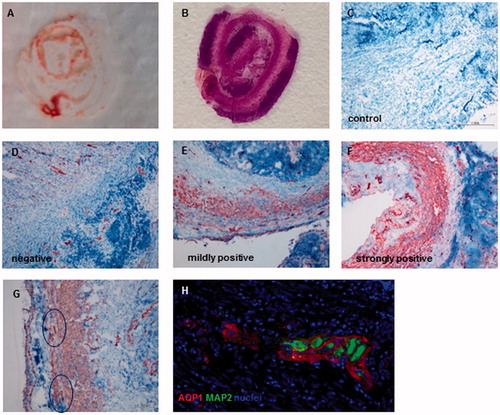
Table 1. Patient characteristic.
Figure 2. Correlation of the stage of the disease with AQP1 expression and CRP and leucocyte count A significantly positive correlation of the stage of the disease with the AQP1 expression (correlation coefficient 0.542, p ≤ 0.001) (A) as well as with CRP and Leucocyte values (correlation coefficient 0.575, p ≤ 0.001) (B) is shown. Moreover, a significantly positive correlation of laboratory inflammation parameters with AQP1 expression in the tissue (correlation coefficient 0.347, p = 0.028) (C) could be found.
![Figure 2. Correlation of the stage of the disease with AQP1 expression and CRP and leucocyte count A significantly positive correlation of the stage of the disease with the AQP1 expression (correlation coefficient 0.542, p ≤ 0.001) (A) as well as with CRP and Leucocyte values (correlation coefficient 0.575, p ≤ 0.001) (B) is shown. Moreover, a significantly positive correlation of laboratory inflammation parameters with AQP1 expression in the tissue (correlation coefficient 0.347, p = 0.028) (C) could be found.](/cms/asset/5c9f4141-3379-4886-9067-e77fef488c42/ienz_a_1347167_f0002_b.jpg)
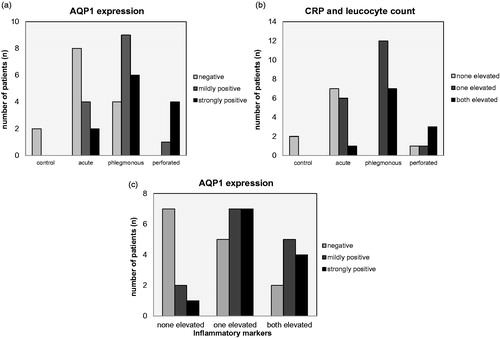
Table 2. Distribution of ganglia.