Figures & data
Figure 1. (a) Structure of 1, 2, 3, 4, and 5 isolated from Rosmarinus offcinalis L.
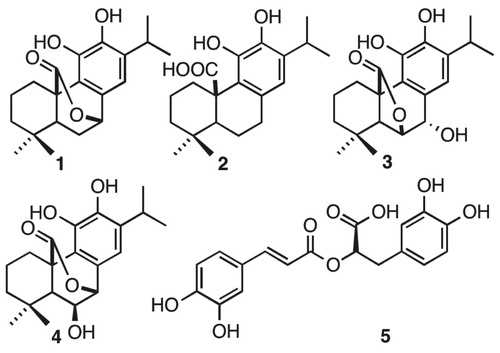
Figure 2. Thioflavine ThT assay over tau fibrillization. (A) Four phenolics diterpenoids, 1, 2, 3, 4, and a caffeoyl derivative 5 were challenged against tau aggregation at 50 μM. All compounds were active as inhibitors against tau aggregation. Data were presented as mean ± SEM and analyzed using ANOVA. Significance was set as p < 0.05.
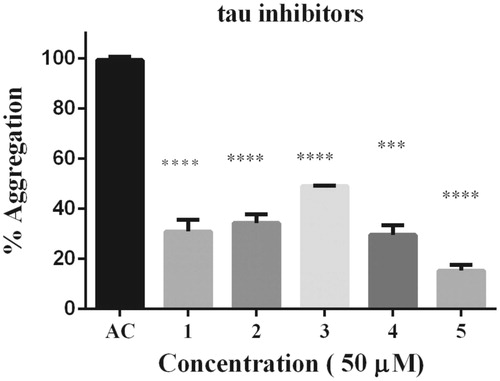
Figure 3. Dose–response effect of 5 over tau 4R aggregation process monitored by ThT. Serial concentration of 5 between 10 μM and 100 μM. B) To obtain IC50 the curve fit method was set as non-linear regression. IC50 calculated correspond to 7.7 μM. Data were presented as mean ± SEM and analyzed using paired t-test showed there was a significant differences between control and treatment conditions t (8) = 15,406, p < 0.05.
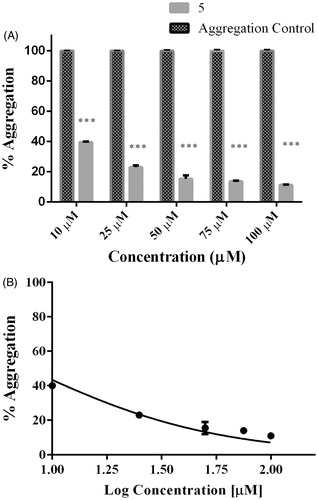
Table 1. Table of Inhibition (%) among phenolic diterpenoids (1,2,3,4) and caffeoyl derivative (5). All compounds inhibit over 50%, including the most active compound 5 (84%).
Figure 4. Atomic force microscopy. Height images of 4R aggregation process in absence (positive control) and presence of 5, at two distinct magnifications. (A) and (D) Positive control (4R aggregation). (B) and (E) 4R aggregation in presence of 5 at 1 μM. (C) and (F) 4R aggregation in presence of 5 at 10 μM. Both gray and orange arrows represent oligomers and fibrils respectively.
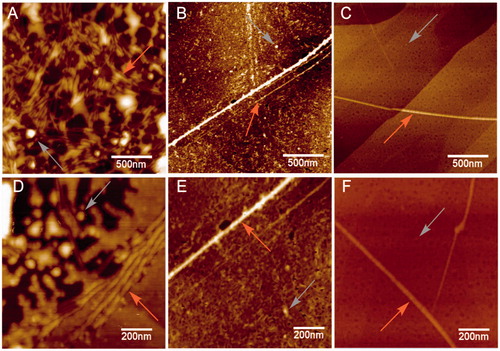
Figure 5. Raman spectra of 4R after aggregation induction in both the absence and presence of 5. (A) Raman spectra of tau aggregation at 532 nm absence of 5. Band assignments correspond to Amide I (1670 cm−1), Amide III (1240 cm−1) and C–H deformation (1451 cm−1). (B) Raman spectra of tau aggregation at 532 nm in presence of 5. Band assignments correspond to Amide I (1670 cm−1), Amide III (1240 cm−1) and C–H deformation (1451 cm−1), Amide III (1260 random coil).
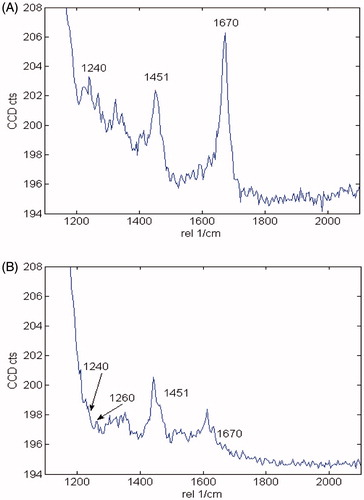
Table 2. Raman Vibrational bands of tau (4R) associated to secondary structure.
Figure 6. Upper panels: Raman maps of tau aggregation in the absence of 5 showing intensities of distinct Raman’s peaks. Images were generated from the same sample region by using the sum filter (integral) over a small window of normal modes: (A) C–H deformation 1451 cm−1 (B) Amide I-1670 cm−1) (C) Amide III-1240 cm−1. Lower panels: Raman maps taken in the same sample region) of tau aggregation in the presence of 5. (D) C–H deformation 1451 cm−1. (E) Amide I-1670 cm−1. (F) Amide III-1240 cm−1.
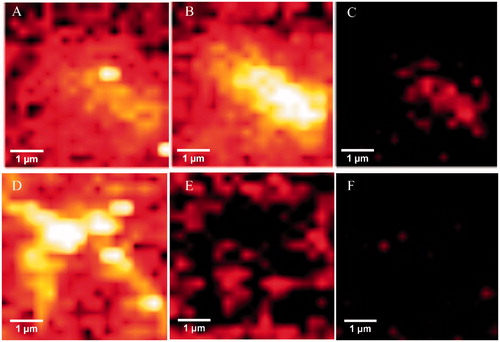
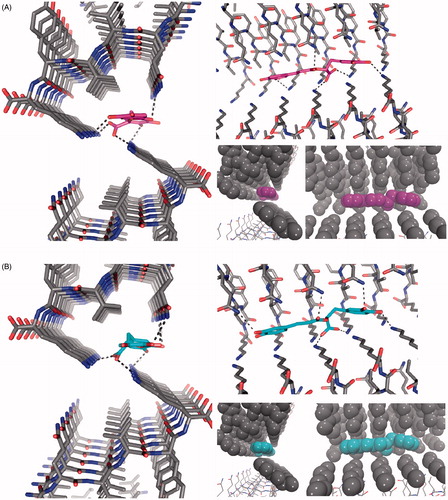
Figure 7. The structure of the 306VQIVYK311 segment from tau protein complexed with rosmarinic acid obtained by docking in the interface of two zippers. The VQIVYK β-sheets segments are packed in parallel forming two steric zippers. The Figure shows 5 mediates contacts between two pairs of steric zippers. (A) R enantiomer, (B) S enantiomer. In both A and B: left: view looks down the fiber axis; right-top: the view is perpendicular to the fiber axis. HBs and ionic interactions between ligand carboxylate and lysine amines are represented with dashed lines; right-bottom: ligand and VQIVYK carbon atoms are represented as balls to observe apolar packing.