
Figures & data
Figure 1. Structural formulas of topiramate (1), JNJ-26990990 (2), 2-methyl-5-nitro-imidazole-sulphamate (3), 2-methyl-5-nitro-imidazole-sulphamide (4) and the topiramate sulphamide analogue (5). hCA II inhibition constants for compounds 3 and 4 are also reportedCitation26.
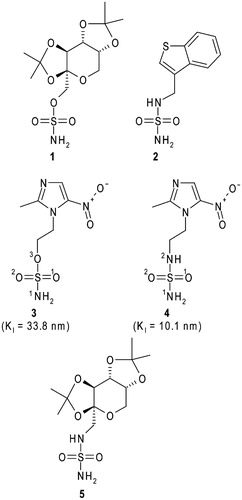
Table 1. Data collection and refinement statistics. Values in parentheses refer to the highest resolution shell (1.86–1.80 Å).
Table 2. Partial atomic charges (e) computed for the three ligands in complex_O, complex_N and complex_NO, respectively. Charges were calculated via the RESP fitting procedure as implemented in the PyRED server using Gaussian09 software.
Figure 2. Active site region in the hCAII/3 complex. Hydrogen bonds, active site Zn2+ coordination and residues establishing van der Waals interactions (distance <4.0 Å) with the inhibitor are reported. Sigma-A weighted |2Fo-Fc| simulated annealing omit map (at 1.0 sigma) relative to the inhibitor molecule is also shown.
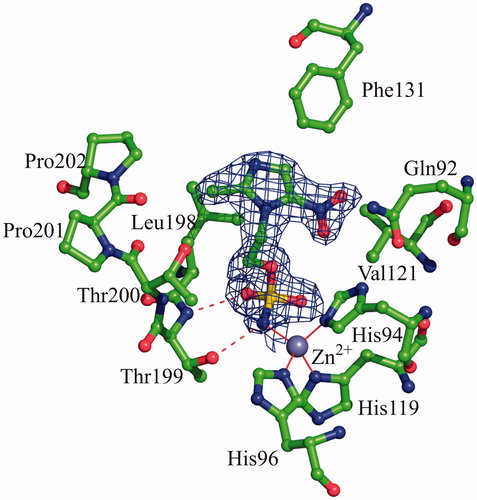
Figure 3. (A) Structural superposition between hCA II/3 (green) and hCA II/4 (white, PDB code 4MO8)Citation26. (B) Active site region in the hCAII/4 complex. Hydrogen bonds, active site Zn2+ coordination and residues establishing van der Waals interactions (distance <4.0 Å) with the inhibitor are reported.
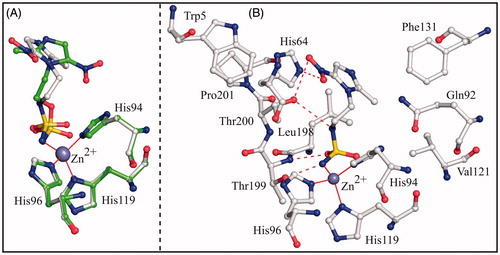
Table 3. Distances between Thr200OG1 atom and the sulphamide N2 atom in hCA II/sulphamide complexes. Only sulphamides of the type R-NH-SO2NH2 were considered.
Table 4. Distances between Thr200OG1 atom and the sulphamate O3 atom in hCA II/sulphamate complexes.
Figure 4. Detail of the active site in the model systems Complex_N (A), Complex_O (B) and Complex_NO (C). In all three cases the ligand, the zinc ion, the three coordinating histidines, Glu106, and enzyme residues giving a major contribution to ligand binding are shown. Only polar hydrogens are shown. Hydrogen bonds are highlighted with red dotted lines, while the distances between O3 and Thr200OG1 are indicated with black arrows.
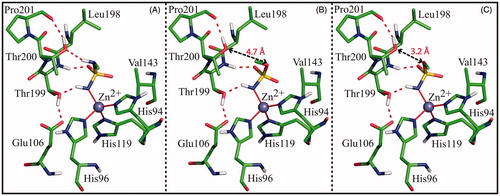
Table 5. Per-residue binding energy decomposition (given in kcal/mol), calculated by the MM/GBSA method for complex_N, complex_NO and complex_O. Only residues contributing more than −1.0 kcal/mol to the binding are reported.
Table 6. Individual energy components (kcal/mol) of ΔGbind-Thr200 calculated by the MM/GBSA method for complex_N, complex_NO and complex_O.