
Figures & data
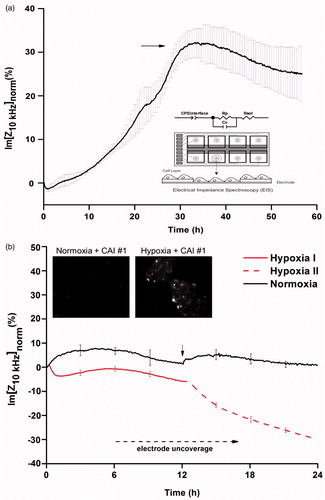
Figure 1. (a) The normalised impedance values (imaginary part at 10 kHz) increase as cells adhere and spread on the electrodes until a monolayer is formed. Data are represented as mean ± SD for n = 7. The electrode set-up and the simplified equivalent circuit for assessing EIS data on cell monolayers are presented in the inset. (b) The response of cells to hypoxic conditions, two subsequent hypoxia phases- impedance data (the imaginary part at 10 kHz). Data are represented as mean ± SD for n = 6. Inset CA IX overexpression highlighted through fluorescent CAI #1 binding.
Supplemental material