Figures & data
Figure 1. Schematic representation of the gene encoding the chimeric membrane bound SspCA. Legend: pelB, the signal sequence for the periplasmic translocation of the protein (21 amino acid residues); INPN domain (204 amino acid residues); Spacer (five amino acid residues); SspCA: the thermostable CA (226 amino acid residues); His-Tag: histidines at the C-terminus (6 amino acid residues).
Figure 2. SDS-PAGE of the whole cells, outer membrane, inner membrane, cytoplasmic fraction coming from the whole cell lysates, and purified free SspCA. Legend: lane STD, molecular markers, M.W. starting from the top: 100 kDa, 75 kDa, 50 kDa, 37 kDa, 25 kDa, 20 kDa; lane 1, whole cells; lane 2, outer membrane; lane 3, inner membrane; lane 4, cytoplasmic fraction coming from the whole cell lysate; lane 5, purified SspCA. Lanes 1 and 2 showed a band at about 50 kDa corresponded to the INPN-SspCA, while lane 5 showed a band at about 25 kDa corresponded to the free SspCA. The band at a molecular weight of 50 kDa represented the overexpression of the chimeric SspCA, which was confirmed by the protonography and Western blot.
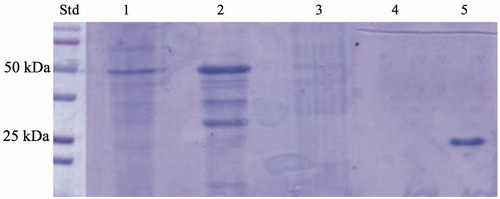
Figure 3. Protonography of the whole cells, outer membrane, inner membrane, cytoplasmic fraction coming from the whole cell lysates, and purified free SspCA. Legend: Lane STD, molecular markers, M.W. starting from the top: 75 kDa, 50 kDa, 37 kDa, 25 kDa, 20 kDa; lane 1, whole cells; lane 2, outer membrane; lane 3, purified SspCA; lane 4, inner membrane; lane 5, cytoplasmic fraction coming from the whole cell lysate. In lanes 1 and 2, the intense yellow band at the molecular weight of about 50 kDa represented the overexpression of the chimeric membrane-bound SspCA. The presence of the yellow bands below the intense band is due to the overloading of the sample on the gel. The yellow band of the lane 3 corresponds to the hydratase activity of the free SspCA. The lanes corresponding to the inner membrane and the cytoplasmic fraction did not evidence the chimeric membrane-bound SspCA.
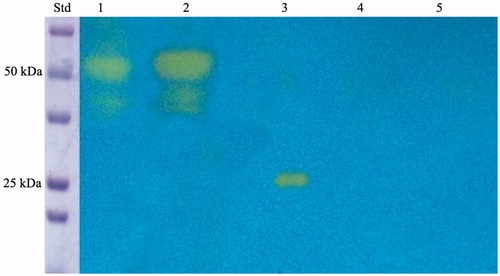
Figure 4. Western blot performed on the whole cells, outer membrane, purified free SspCA, inner membrane, and cytoplasmic fraction coming from the whole cell lysates. Legend: Lane Std, molecular markers, M.W. starting from the top: 100 kDa, 75 kDa, 50 kDa, 37 kDa, 25 kDa, and 20 kDa; lane 1, whole cells; lane 2, outer membrane; lane 3, purified SspCA; lane 4, inner membrane; lane 5, cytoplasmic fraction coming from the whole cell lysates. Lanes 1 and 2 showed a band at about 50 kDa corresponded to the INPN-SspCA, while lane 3 showed a band at about 25 kDa corresponded to the free SspCA. Both bands were identified using the anti-His-Tag antibody. Lanes 4 (inner membrane) and 5 (cytoplasmic fraction) did not evidence the presence of the chimeric SspCA.
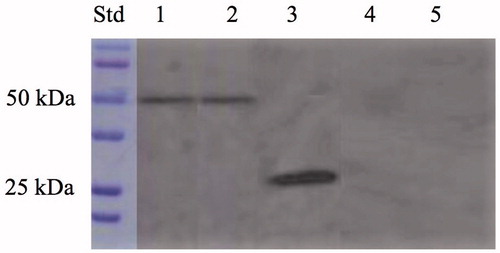
Figure 5. Temperature stability of the free SspCA and membrane-bound SspCA carried out at 25, 50 and 70 °C. Continuous line: free SspCA; dashed line: membrane-bound SspCA. Each point is the mean of three independent determinations.
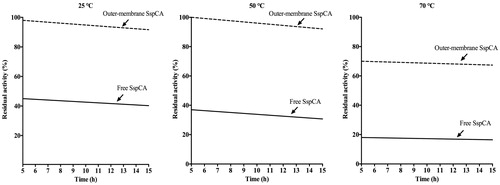
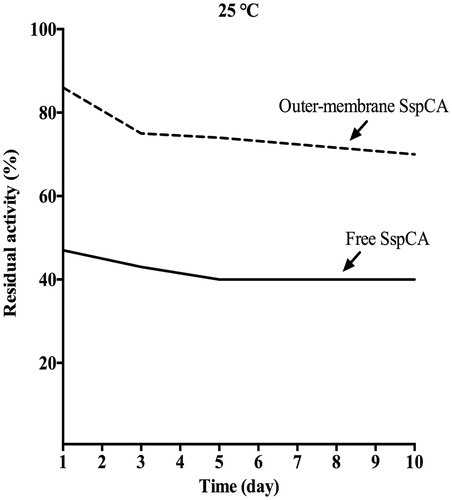
Figure 6. The long-term stability of free and membrane-bound SspCA. Long-term stability was performed at 25 °C measuring the residual activity of the free and membrane-bound SspCA at the days indicated on the x-axis. Continuous line: free SspCA; dashed line: membrane-bound SspCA. Each point is the mean of three independent determinations.