
Figures & data
Figure 1. Chemical structures of isolated geranyl compounds (1–8) from the fruits of P. tomentosa.
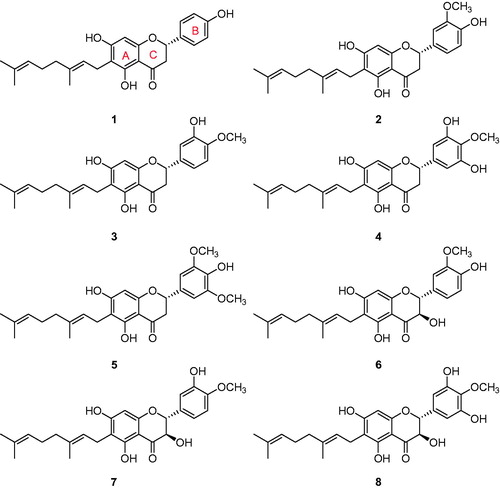
Figure 2. (A) Inhibitory effect of compound (1) and positive control (NaVO4) on PTP1B activity. (B) Determination of the reversible inhibitory mechanism of compound 1 on PTP1B. Data represent the results of three independent experiments performed in triplicates for each sample.
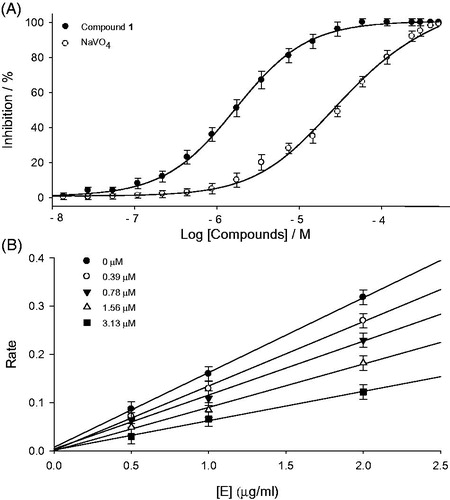
Figure 3. (A–D) Kinetic assays of PTP1B inhibition, caused by compounds 1 and 6. (A and B) Lineweaver–Burk plots were constructed for the inhibition of PTP1B. The plots are expressed as 1/velocity (1/V) versus 1/substrate (1/[S]) with or without inhibitors. Insets (I) and (II) represents the secondary plots of the slopes and the intercepts of the straight lines versus concentrations of compound 1 and 6. (C and D) Dixon plots for inhibition of PTP1B by compound 1 and 6, respectively.
![Figure 3. (A–D) Kinetic assays of PTP1B inhibition, caused by compounds 1 and 6. (A and B) Lineweaver–Burk plots were constructed for the inhibition of PTP1B. The plots are expressed as 1/velocity (1/V) versus 1/substrate (1/[S]) with or without inhibitors. Insets (I) and (II) represents the secondary plots of the slopes and the intercepts of the straight lines versus concentrations of compound 1 and 6. (C and D) Dixon plots for inhibition of PTP1B by compound 1 and 6, respectively.](/cms/asset/f2855da4-1974-4861-bfbd-c76d14042b21/ienz_a_1368502_f0003_b.jpg)
Table 1. Inhibitory activities on PTP1B and α-glucosidase of isolated compounds.
Figure 4. (A) Inhibitory effects of compounds (1–8) on α-glucosidase activity. (B and C) Linweaver–Burk plots of compounds 4 and 8 for the inhibition of α-glucosidase catalyzed hydrolysis of p-nitrophenyl glucopyranoside. (D and E) Dixon plots of inhibition of α-glucosidase by compounds 4 and 8, respectively, which were used for determination of Ki values.
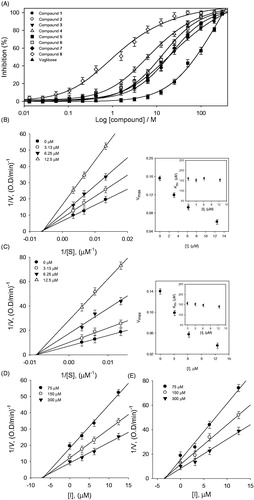
Table 2. Effect of different concentrations of compound 1 on Vmax, Km, and the Kik to Kiv ratio using PTP1B and α-glucosidase.