
Figures & data
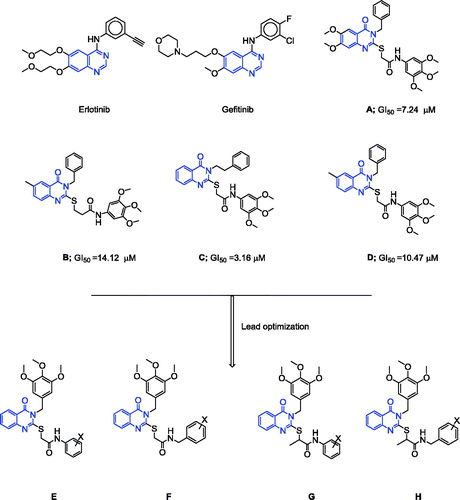
Figure 1. Structures of erlotinib, gefitinib, reported compounds A–D, and designed quinazoline derivatives E–H as antitumour agents.
Scheme 1. Synthesis of new quinazoline conjugates 1–20.
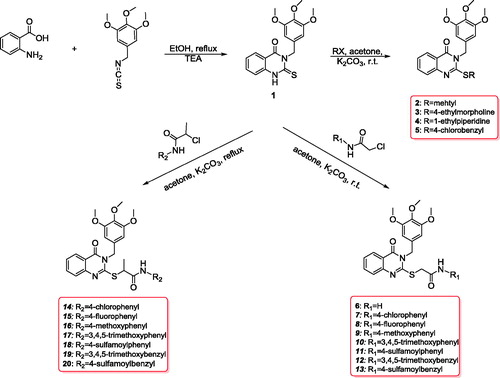
Table 1. Percentage growth inhibition (GI %) of in vitro subpanel tumour cell lines at 10 µM concentration.
Table 2. Median growth inhibitory (GI50, μM), total growth inhibitory (TGI, μM), and median lethal (LC50, μM) concentrations of compounds 7 and 19 on in vitro subpanel tumour cell lines.
Table 3. GI50 values (μM) of compounds 7 and 19 compared with those of erlotinib, gefitinib, and 5-FU on in vitro subpanel tumour cell lines.
Figure 2. Three-dimensional (3D) interactions of erlotinib (upper panel), compounds 19 (middle panel) and 7 (lower panel) with the receptor pocket of EGFR kinase. Hydrogen bonds are shown with a green line.
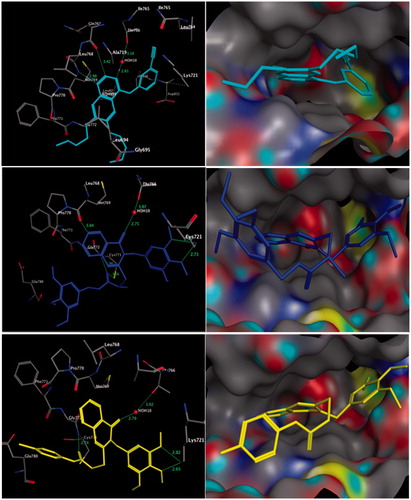
Table 4. Results of the docking of compounds 7 and 19 into EGFR (pdb: 1m17), in comparison to the co-crystallised ligand (erlotinib).