
Figures & data
Figure 1. Activated methyl cycle (AMC) of mammalian cells.
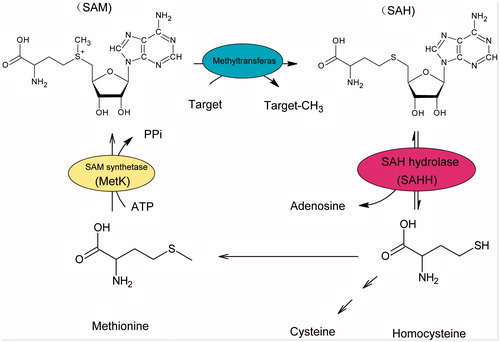
Figure 2. (a) Schematic diagram of the P. pastoris expression plasmid, pPIC9K-sahh. The nucleotide sequence encoding 6 × His-sahh was attached in-frame. (b) rsahh-Positive transformant selected by colony-PCR, 1. 15,000 bp DNA marker. 2. pPIC9K-sahh.
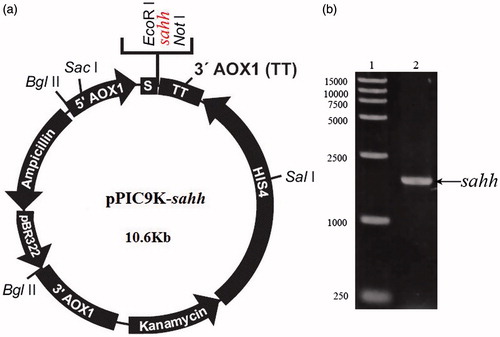
Figure 3. (a) Determining the molecular weight of the purified protein by SDS-PAGE. 1. Molecular weight protein standards. 2. A single band was detected with a molecular weight of approximately 47.5 kDa. (b) Michaelis–Menten equation of double-reciprocal. The red line shows linear relationship.
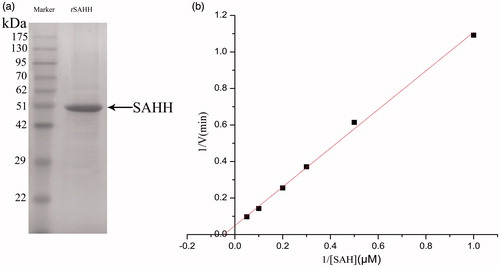
Figure 4. Effect of (a) temperature and (b) pH on SAH cleaving activity of purified recombinant full-length nucleosidase (rSAHH). Experiments were performed as described in the section “Materials and methods”. Each bar represents the average of three experimental determinations ± standard error.
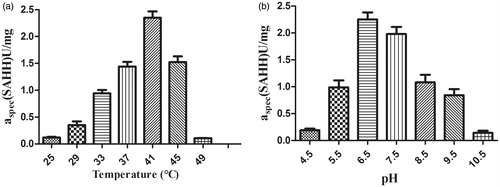
Figure 5. Structure of thirteen SAHH inhibitors.
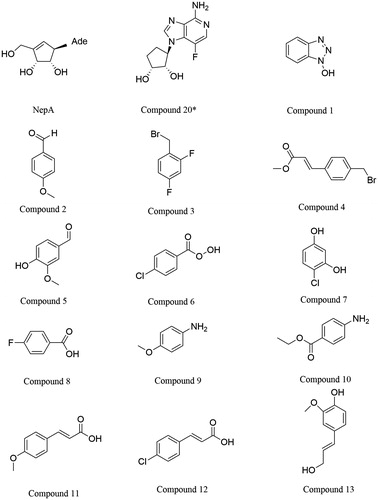
Figure 6. Docking simulations showed the detail of coniferyl alcohol binding site in SAHH active pocket. Hydrogen bonds are represented by dotted pink lines.
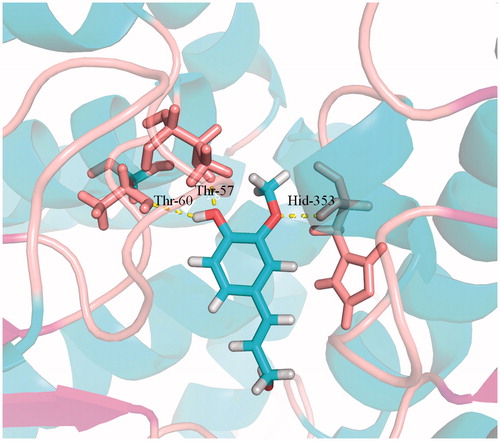
Table 1. Calculated IC50 values of the most potent compounds determined for SAHH and compared with NepA and Compound 20Table Footnote*.