Figures & data
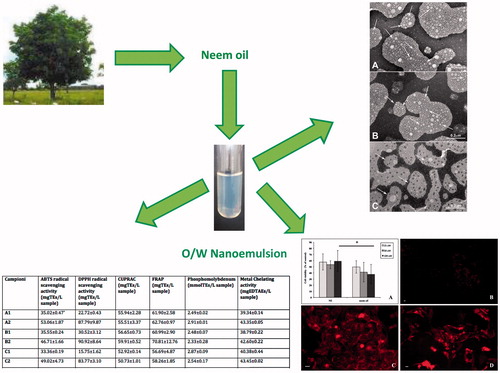
Table 1. Sample compositions, size, ζ-potential, PDI values and lipophilic shell features (polarity and microviscosity) of NEs.
Figure 1. Shelf-life stability of evaluated NEs. Hydrodynamic diameter and ζ-potential values of different NEs (A–C) prepared using water1 or Hepes buffer2 as aqueous phase up to 90 days stored at 25 and 4 °C temperatures. Results are expressed as means ± SD (n = 3).
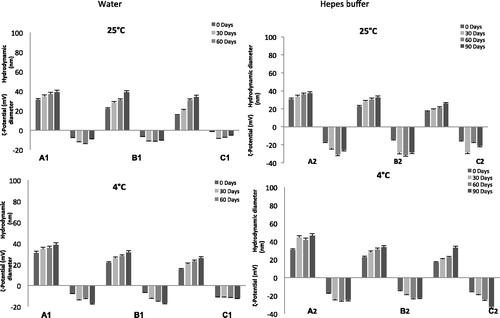
Figure 2. Stability in CSF. Size and ζ-potential measurements by DLS of different NEs (A–C) prepared using water (A) and Hepes buffer 10−2 M, pH 7.4 (B) at 37 °C up to 3 h.
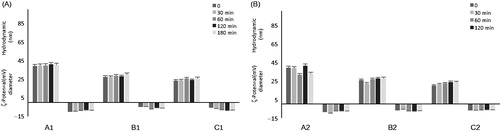
Figure 3. SAXS intensity spectrum. Scattered radiation intensity as a function of momentum transfer q of A2 sample at room temperature. The flattening of the intensity for q < 0.1 nm−1 shows that aggregates have a globular shape of finite size, of the order of 30 nm. At higher q (0.18 < q < 0.75 nm−1), the intensity I(q)/q−1.66. This decay behaviour is characteristic for an internal core composed by connected substructures or sponge phases.
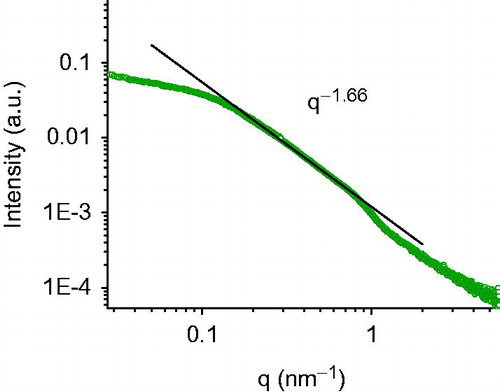
Figure 4. Transmission electron photomicrographs of the Hepes nanoemulsion samples. Panel A: A2; Panel B: B2; Panel C: C2. Arrows indicate NE sizes corresponding to DLS measures.
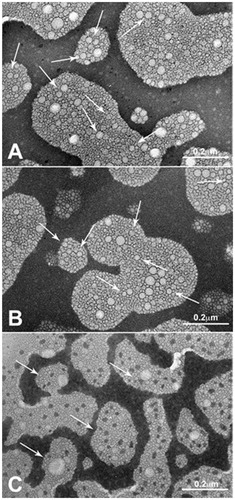
Table 2. Antioxidant and chelating properties of pure Neem oil.
Table 3. Antioxidant and chelating properties of prepared Neem oil-loaded NEs.
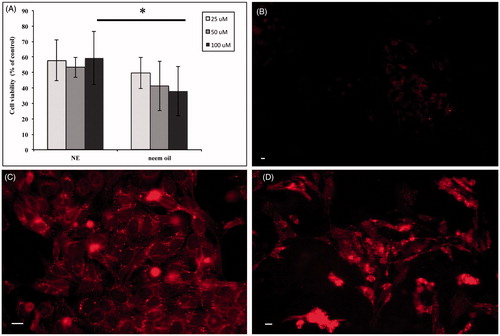
Figure 5. Exposure of HEp-2 cells to Neem oil-based NEs. HEp-2 cells were treated with NEs or free Neem oil as described (see Methods). The OD values obtained by MTT assay for treated cells were converted into numbers of cells on a standard curve and expressed as percentages of untreated controls. Bars represent the mean of three independent experiments ± SD. *p < .05 (Panel A). Fluorescence microscopy images of HEp-2 control cells exposed to free Nile red (Panel B) and HEp-2 cells exposed to Nile red-loaded NEs for 7 (Panel C) and 24 h (Panel D) obtained by fluorescence microscopy as described (see Methods). Scale bar: 10 μm.