Figures & data
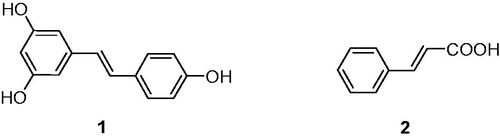
Figure 1. Structure of resveratrol (1) and cinnamic acid (2).
Scheme 1. Reagents and conditions: (i) DCC, DMAP, DCM, substituted aromatic phenolic compounds, room temperature, 2 h.
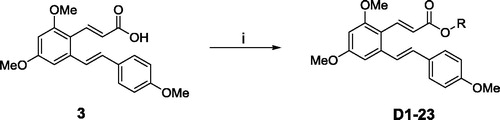
Table 1. Chemical structures of the title compounds.
Figure 2. Crystal structure of compound D2.
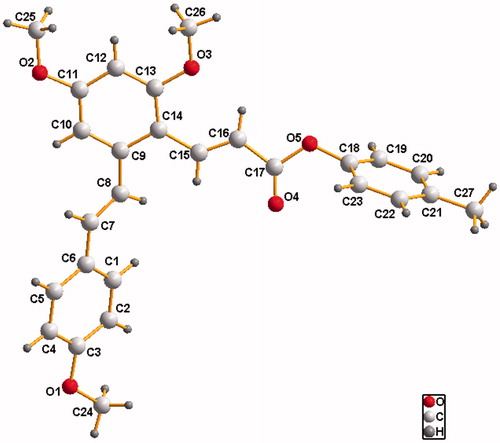
Table 2. Crystallographic data and structure refinements for compound D2.
Table 3. Selected bond lengths (Å) and angles (°) for compound D2.
Figure 3. Effects of compounds D1–D23 on production of NO by RAW264.7 cell RAW264.7 cells were pretreated with D1–D23 (40 μM) for 4 h, and then stimulated with or without LPS (1 μg/mL) for 24 h. NO production was measured using nitrite and nitrate assay. ###p < .001 compared with unstimulated cells, *p < .05, **p < .01 and ***p < .001 compared with LPS-stimulated cells; Data were from at least three independent experiments, each performed in duplicate.
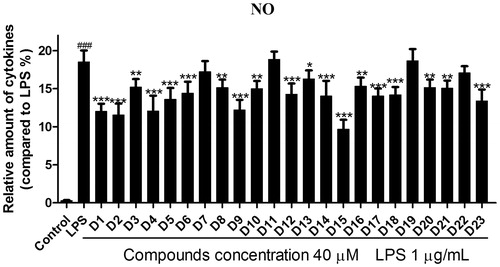
Figure 4. Compound D15 inhibited LPS-induced inflammatory response in RAW 264.7 cells. Cells were treated with compound D15 (10, 20, 40 µM) for 12 h, and then stimulated by LPS (1 µg/ml) for 3 h. Cell viability was evaluated using the MTT assay. NO production was measured using nitrite and nitrate assay. iNOS and COX-2 expression were detected by Western blot analysis. (A) Cell viability assay; (B) Quantitative analysis of NO production. (C) Quantitative analysis of iNOS and COX-2 expression, β-actin was used as loading control. ###p < .001 compared with unstimulated cells, **p < .01 and ***p < .001 compared with LPS-stimulated cells. Data were from at least three independent experiments, each performed in duplicate.
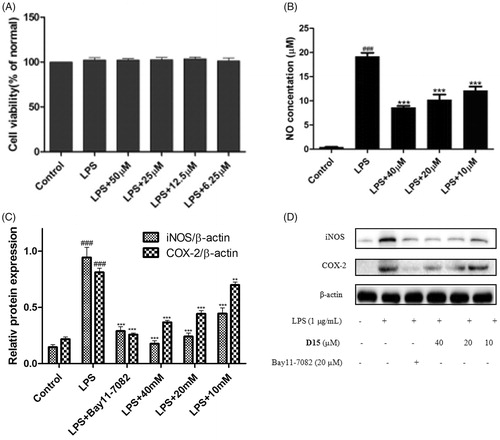
Figure 5. Compound D15 suppressed LPS-induced activation of NF-κB signaling pathway in RAW 264.7 cells. After pretreatment with D15 (10 ∼ 40 µM), RAW 264.7 cells were stimulated with LPS (1 µg/mL) for 30 min. The total and phosphorylation levels of NF-κB were detected by Western blot. (A) Quantitative analysis of p-IκB and p-p65, total IκB and p65 were used as loading control, respectively. (B) Immunofluorescence analysis of compound D15. ###p < .001 compared with unstimulated cells, *p < .05 and ***p < .001 compared with LPS-stimulated cells. Data were from at least three independent experiments, each performed in duplicate.
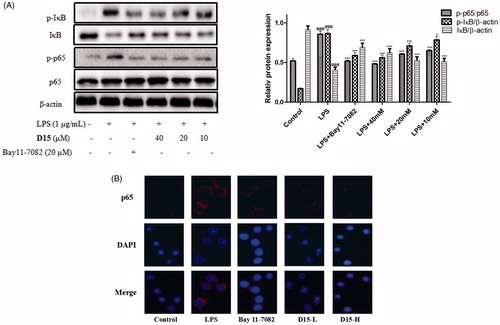
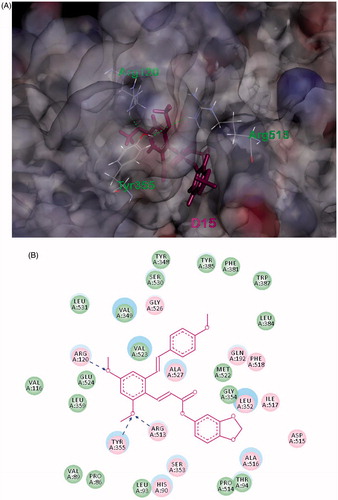
Figure 6. (A) Binding model of D15 (purple) in the active site of COX-2. The H-bond is displayed as blue dashed line. (B) 2Dprojection drawing of D15 docked into COX-2 active site.