
Figures & data
Figure 1. Cytotoxic effect of PBA 0.1, 1.0 and 10 mg/ml (0.82, 8.2 and 82 mM) on mammary adenocarcinoma 4T1 and squamous cell carcinoma SCCVII. Cells survival rate measured by crystal violet assay. Absorbance at 590 nm is proportional to the number of surviving cells. Each experiment was done in quadruplicate. Inhibition of cell growth I (%) relative to controls was calculated according to the formula: I = (C − T)/C × 100, where T denotes the mean absorbance of treated cells, and C indicates the mean absorbance of untreated cells, without the addition of PBA.
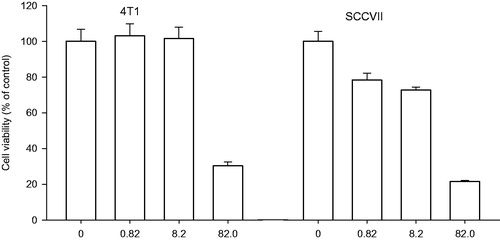
Figure 2. Cytotoxic effect of PBA 0.1, 1.0 and 10 mg/ml (0.82, 8.2 and 82 mM) on hamster lung fibroblast V79 and mouse dermal fibroblasts L929 cell lines. Cells survival rate measured by crystal violet assay. Absorbance at 590 nm is proportional to the number of surviving cells. Each experiment was done in quadruplicate. Inhibition of cell growth I (%) relative to controls was calculated according to the formula: I = (C − T)/C × 100, where T denotes the mean absorbance of treated cells, and C indicates the mean absorbance of untreated cells, without the addition of PBA.
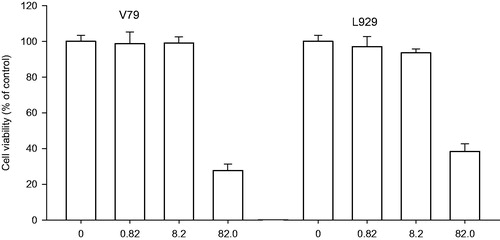
Figure 3. The effect of intra-peritoneal (i.p.), intra-tumour (i.t.) and per-oral (p.o.) application of PBA on the growth of squamous cell carcinoma SCCVII transplanted into mouse thigh. PBA was injected in a dose of 100 mg/kg once a day for nine consecutive days starting from Day 9 after tumour transplantation. Each experimental group consisted of seven animals. Different letters beside the symbols indicate significant differences between the groups (p<.05, Tukey’s post hoc test) at the end of the treatment (arrow).
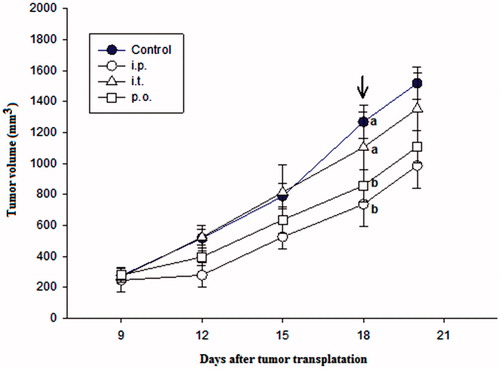
Figure 4. The effect of intra-peritoneal (i.p.), intra-tumour (i.t.) and per-oral (p.o.) application of PBA on the growth of mammary adenocarcinoma 4T1 transplanted into mouse thigh. PBA was injected in a dose of 100 mg/kg once a day for nine consecutive days starting from Day 9 after tumour transplantation. Each experimental group consisted of seven animals. Different letters beside the symbols indicate significant differences between the groups (p < .05, Tukey’s post hoc test) at the end of the treatment (arrow).
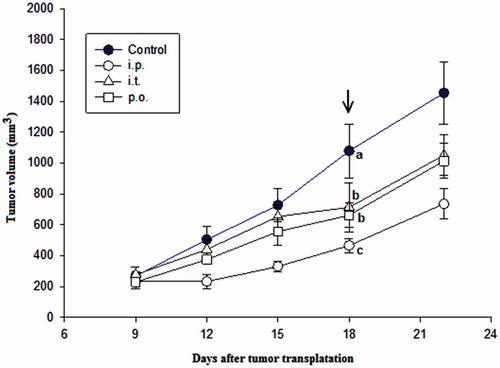
Table 1. Tumour parameters after transplantation of mammary adenocarcinoma 4T1 and squamous carcinoma SCCVII cells in syngeneic mouse and their treatment by PBA in the different administration routes.