Figures & data
Figure 1. Preparation of nanoemulsion by high-energy method.
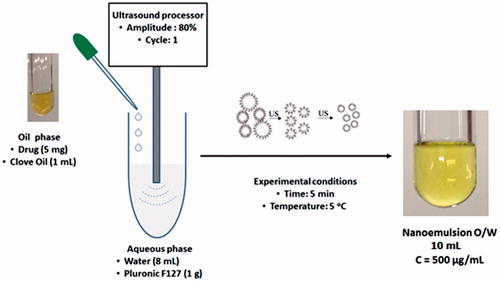
Figure 2. Sulfonamides 3F, 3G, 3W, 5B, 5C, and 5D used in the study and their TcCA inhibitory action.
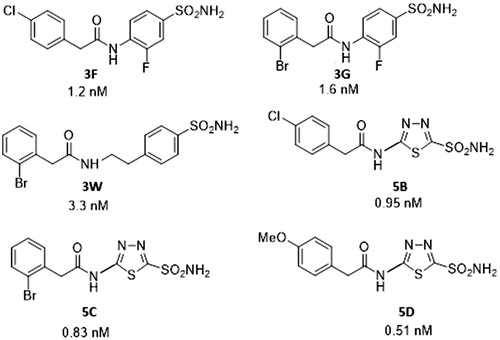
Table 1. NEs size and polydispersity index
Figure 3. Inhibition effects of different concentrations of nanoemulsions with sulfonamide derivatives (1–128 μM) 3F, 3G, 3W, 5B, 5C, 5D. (A and C) Epimastigotes T. cruzi Dm28c strain; (B and D) epimastigotes T. cruzi Y strain, after 5 days of incubation. CTL control nanoemulsions without sulfonamide derivatives, BZD: benznidazole reference drug (1–128 μM).
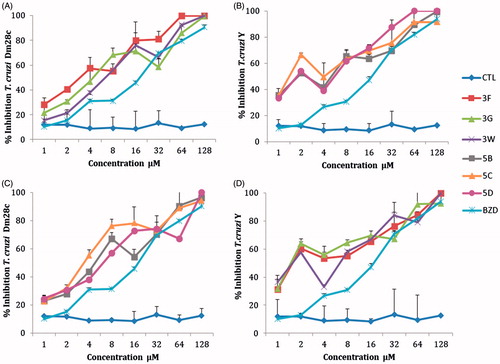
Table 2. IC50 and IC90 values derived from growth inhibition assays of Trypanosoma cruzi (DM28c, Y) and determination of cytotoxicity (CC50), selectivity index (SI50) of 3F, 3G, 3W, 5B, 5C, 5D NEs.
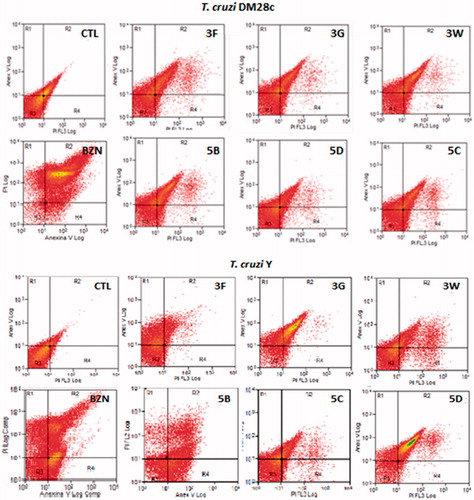
Figure 4. Representative graphs of flow cytometric analysis for nanoemulsions of the sulfonamides 3F, 3G, 3W, 5B, 5C, 5D, and benznidazole (BZN) at 32 μΜ. (A, C) Necrosis using propidium iodide (PI) and (B, D) apoptosis using annexin V-FITC (ANV).
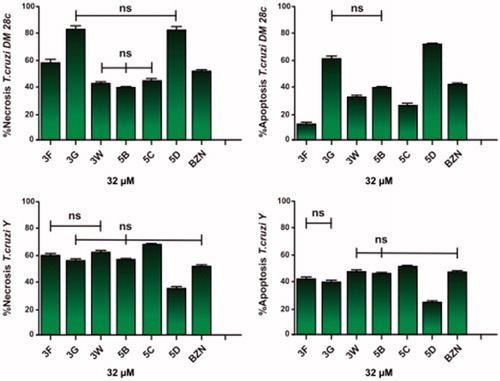
Figure 5. Histogram of epimastigotes representative of apoptosis analysis by flow cytometry using propidium iodide (PI) and annexin V-FITC. CTL: control without sulfonamides derivates (A) T. cruzi Dm28c and (B) T. cruzi Y Nanoemulsions of 3F, 3G, 3W, 5B, 5C, 5D sulfonamides derivatives at 32 μM. R1: Cells marked with PI only (necrosis); R2: cells labelled with annexin V and PI (late apoptosis); R3: unlabelled cells (viable cells); R4: cells marked only with annexin V (early apoptosis).