Figures & data
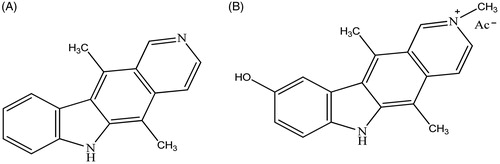
Figure 1. Structures of Ellipticine (A) and Celiptium (B).
Scheme 1. Synthesis of N-9H-alkyltiocarbazoles 5–7a–c. Reagents and conditions: (i) 1, N-dibromoalkane, NaH 60%, DMF, rt; (ii) Thiourea, i-PrOH, reflux, 12 h; NaOH 6 N, reflux, 5 h; HCl 3 N, rt, 10 min.
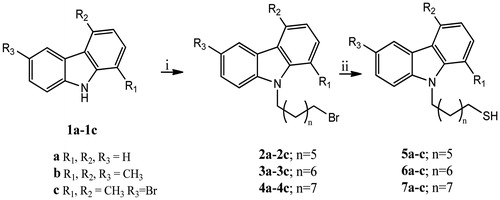
Table 1. Antiproliferative activity: IC50 values of carbazole derivatives (5a–c, 6a–c, 7a–c) and Ellipticine, expressed in micromolar (µM).
Figure 2. hTopoII inhibition assay. kDNA was incubated with human Topoisomerase II in the absence (lane C, vehicle DMSO) or presence of compound 5c (lane 5c) or Ellipticine (lane E) at 10 and 50 µM, respectively. Lane K, kinetoplast DNA (kDNA).
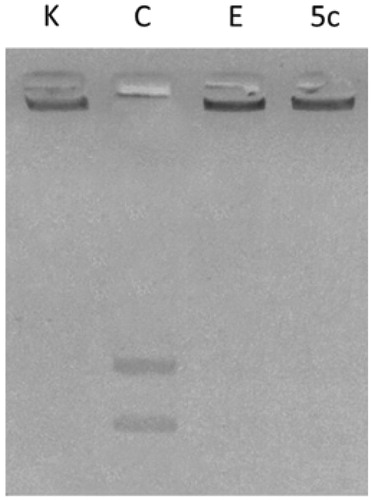
Figure 3. Panel (A) Ribbon representation of a dimeric hTopoII (chains A and B coloured in pink and olive green respectively) in complex with DNA (yellow ribbon and blue lego). The area within the orange rectangle highlights ATP binding site. Panel (B) A close up of the ATP binding site showing the different binding modes of AMP-PNP, a non-hydrolisable ATP analogue, (orange) and 5c (black sticks) as suggested by docking simulations. Panel (C) shows the protein residues involved in 5c binding.
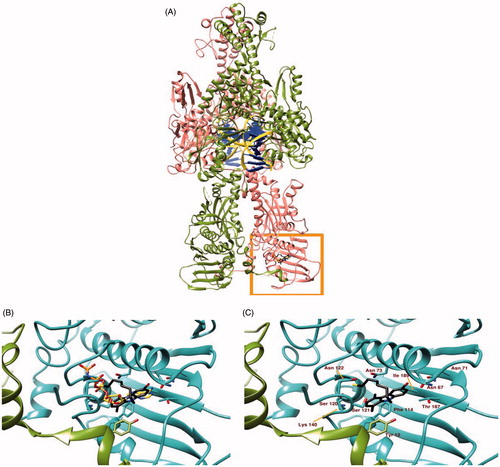
Figure 4. Parp-1 cleavage: time course of PARP-1 cleavage in uterine cancer Hela cells treated with 5c, used at a concentration equal to its IC50 value. The control shown is referred to 72 h of vehicle exposure, but same results was obtained for 24 and 48 h. GAPDH was used as loading normalisation.
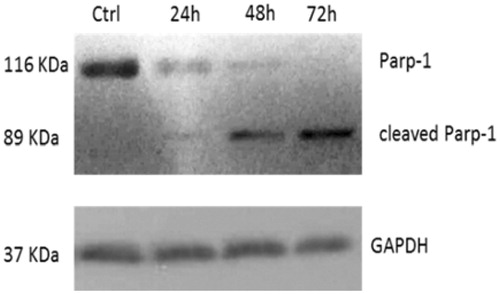
Figure 5. TUNEL assay of HeLa cells. Cells were treated for 24 h with compound 5c (at the concentration equal to its IC50) or with vehicle (CTRL). Then they were fixed, subjected to TdT reaction, washed, dyed with DAPI and imaged under a fluorescence microscope (20× magnification, excitation/emission wavelength 490 nm/515 nm for CF™488 A, panels B, and 350 nm/460 nm for DAPI, panels A). Panels C show the merge.
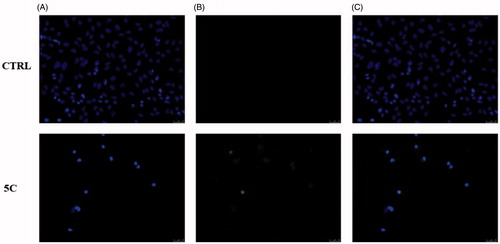
Figure 6. Caspases activity. Activation of caspases 3/7 and 9 following to the treatment of HeLa cells with the compound 5c at a concentration equal to its IC50 value for 24 h. Columns mean, bars SD, *p < .001.
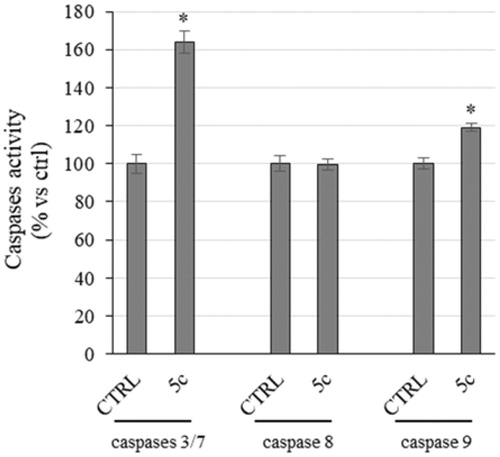
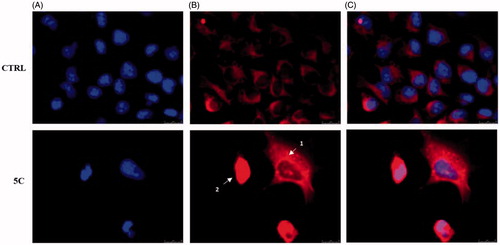
Figure 7. Cytochrome c release during apoptosis in Hela cells. In vehicle-treated cells Cytochrome c is localised within the mitochondria (panel B, CTRL). During the early stages of apoptosis, induced by compound 5c treatment at the concentration equal to its IC50 for 24 h, mitochondria fragmentation occurs (as shown by the red dots indicated by arrow 1 in panel B, 5c) and Cytochrome c is partially released. In the last apoptotic cell stage, a full release of Cytochrome c is observed (diffused red fluorescence, indicated by the white arrow 2). Panel A, DAPI (excitation/emission wavelength 350 nm/460 nm), panel B, Alexa Fluor® 568 (excitation/emission wavelength 578 nm/603 nm), panel C, overlay. Images were acquired at 63× magnification and are representative of three separated experiments.