Figures & data
Table 1. Primers used in the real-time PCR assay.
Table 2. Differences in OD values resulting from comparison of bacterial growth (E. coli strain MG1655 lysogenic for Φ24B) in control culture (DMSO) and cultures carried out with the analyzed compounds. Each experiment was conducted during 9 h, in the presence or absence of mitomycin C (MITC).
Figure 1. Structures of the selected 15 compounds.
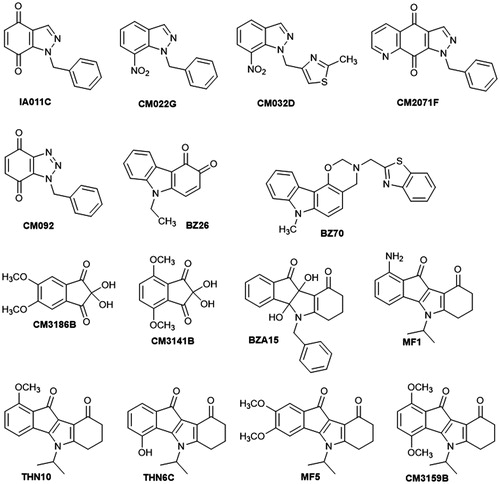
Figure 2. Chemical procedure for the synthesis of targeted indenoindoles.
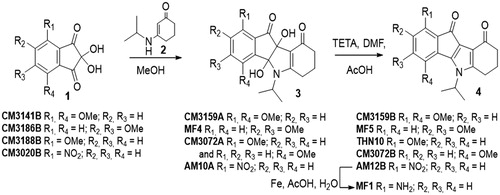
Figure 3. Correlations observed from NOE experiments for CM3072B.
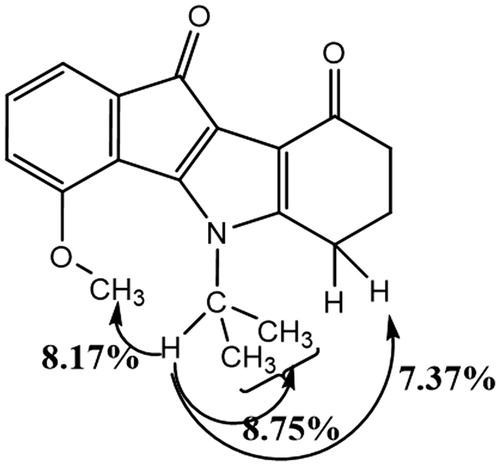
Figure 4. Correlations observed from NOESY experiment for THN10.
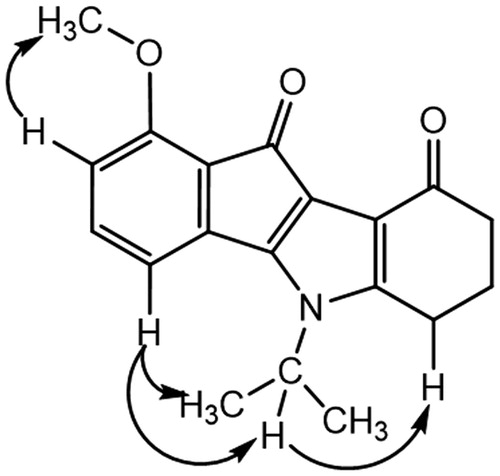
Figure 5. NOESY interactions for AM10A.
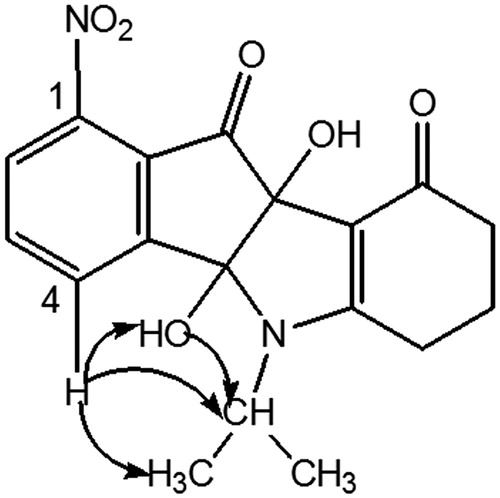
Table 3. 2 D 1H–13 C HMBC correlations for AM10A (DMSO, 500.13 MHz).
Figure 6. Growth of E. coli MG1655 lysogenic with Φ24BΔstx2::cat at 37 °C in LB medium after induction with 0.5 µg/ml mitomycin C (added to the culture at time 3 h) in the absence or presence of tested compounds at indicated concentrations (added to the culture at time 0). Bacterial growth was monitored by measurement of A600 at indicated times. Presented results are mean values from three experiments with SD indicated as error bars.
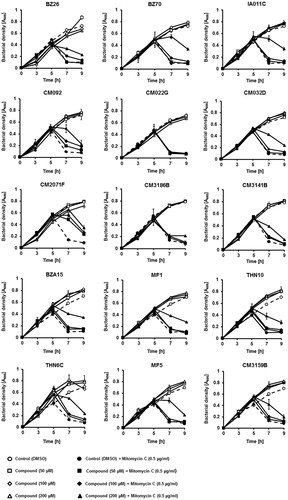
Figure 7. Relative phage titer in cultures of E. coli MG1655 lysogenic with Φ24BΔstx2::cat treated with 0.5 µg/ml mitomycin C (A) or 1 mM H2O2 (B) (inducers were added to the culture at time 3 h) in the absence (control experiments) or presence of tested compounds at indicted concentrations (added to the culture at time 0). Presented results are mean values from three experiments with SD indicated as error bars.
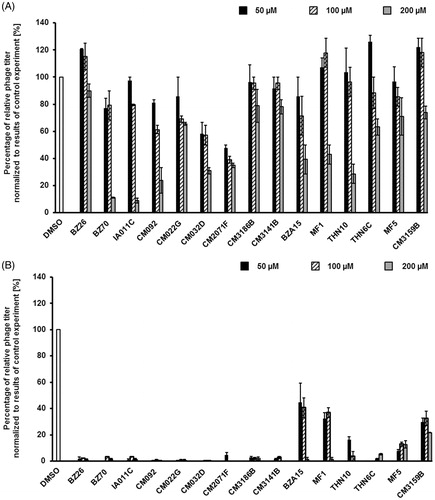
Figure 8. Viability of human HEK-293 and HDFa cells in cultures treated with tested compounds at indicated concentrations for 48 h. Cell viability was tested in the MTT test. Presented results are mean values from three experiments with SD indicated as error bars. The significance of differences between control and cells treated with tested compounds was assessed by the ANOVA test. Differences were marked by asterisks (*) and considered significant when the p value was <0.05.
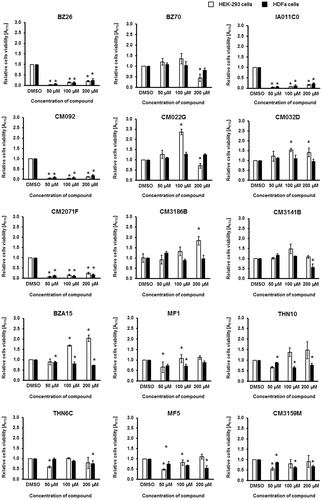
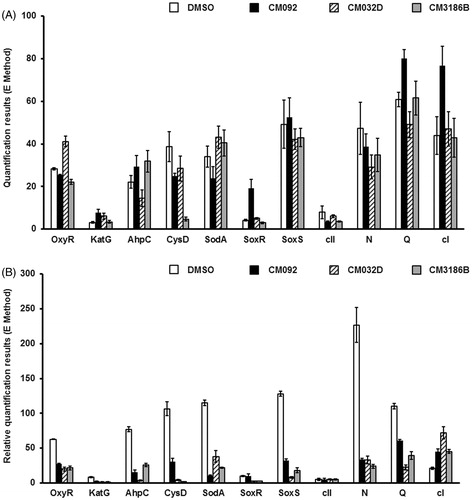
Figure 9. Expression of bacterial genes coding for proteins involved in the oxidative stress response and of selected bacteriophage genes in E. coli MG1655 lysogenic with Φ24BΔstx2::cat either non-treated (A) or after induction with 1 mM H2O2 (B) in the absence (control experiments) or presence of tested compounds added to final concentration of 0.2 mM. Levels of mRNAs were determined by RT-qPCR. Presented results are mean values from three experiments with SD indicated as error bars.