
Figures & data
Scheme 1. Synthetic route of compounds (1–18).
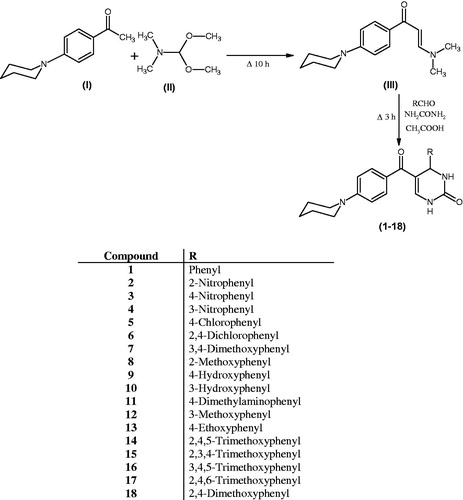
Figure 1. Single crystal X-ray structure of enaminone (III).
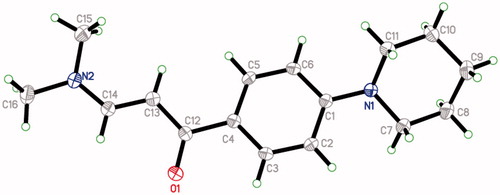
Figure 2. Single crystal X-ray structure of compound 13.
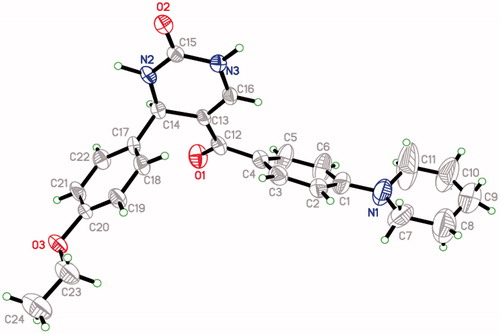
Table 1. The effect of compounds on gastric lesions induced by 80% ethanol (mean ± SE).
Table 2. The effect of compounds on gastric lesions induced by necrotising agents (mean ± SE).
Table 3. The effect of compounds on indomethacin-induced gastric mucosal lesions (mean ± SE).
Table 4. The effect of compounds on hypothermic restraint stress-induced intraluminal bleeding and gastric lesion in rats (mean ± SE).
Table 5. The effect of compounds on gastric secretion, acidity and gastric lesion index in pylorus-ligated shay rats (mean ± SE).
Figure 3. (A) Treatment with 80% ethanol only, showing mucosal ulceration. (B) Treatment with ranitidine (50 mg/kg) showing normal mucosa. (C) Treatment with compound 3 (50 mg/kg) showing intact mucosa with mild ulceration. (D) Treatment with compound 8 (50 mg/kg) showing intact normal mucosa. (E) Treatment with compound 11 (50 mg/kg) showing intact normal mucosa. (F) Treatment with compound 15 (50 mg/kg) showing intact normal mucosa.
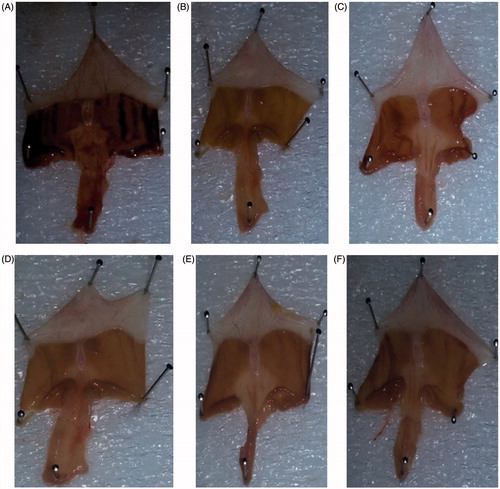
Table 6. The effect of compounds on the change in gastric wall mucus in stomach tissue induced by 80% ethanol (mean ± SE).
Figure 4. Light micrographs showing the effect of compounds 3, 8, 11 and 15 on ethanol-induced gastric lesions of rats. (A) Treatment with ethanol (PAS); (B) pre-treatment with standard drug ranitidine (50 mg/kg) (PAS); (C) pre-treatment with compound 3 (50 mg/kg) (PAS); (D) pre-treatment with compound 8 (50 mg/kg) (PAS); (E) pre-treatment with compound 11 (50 mg/kg) (PAS); (F) pre-treatment with compound 15 (50 mg/kg) (PAS).
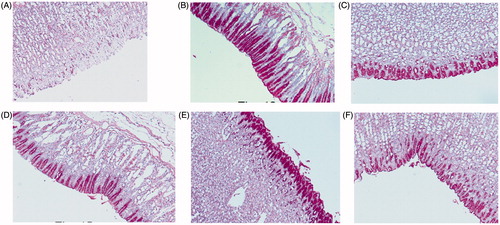
Table 7. The effect of compounds on the levels of MDA, NP-SH and TP in stomach tissue induced by 80% ethanol (mean ± SE).
Table 8. Determination of LD50 of active compounds by Karber method.