Figures & data
Figure 1. Esophageal carcinoma tissue and microarray. (A) Tissue micro array (TMA) of esophageal carcinoma primary tumour and metastatic tissue was examined for CAIX expression and grouped into negative, moderate, and strong CAIX expression. Figure 1(A) shows representative samples of immunohistochemical CAIX staining for adenocarcinoma and squamous cell carcinoma at a standard magnification of ×20. (B) Patients with a moderate CAIX expression had a significantly worse overall (p = .003 and p = .009) and disease free (p = .006 and p = .015) survival compared to patients with no or a strong CAIX expression. (C,D) CAIX expression of primary tumour was correlated with CAIX expression of lymph node and organ metastases (representative immunohistochemical stainings are shown in Figure 1(C). Figure 1(D) shows the correlation of the intensity of CAIX staining (0-none, 1-low, 2-moderate, 3-strong, 4-strongest) of primary tumour and metastases. The left graph depicts the intensity of CAIX staining of the lymph node metastases, the right graph shows the intensities of the organ metastases in correlation to the intensity score of their primary tumour. Interestingly, most lymph node metastases occurred in the group with a moderate CAIX expression and thus impaired prognosis (group 2 in Figure 1(D)) and the metastatic lymph nodes of these patients overall expressed CAIX in higher intensities than any of the others. (E) All tumour samples (n = 10), although to a different extent, showed an increased expression of RNA levels in quantitative PCR compared to their respective normal mucosal control tissues.
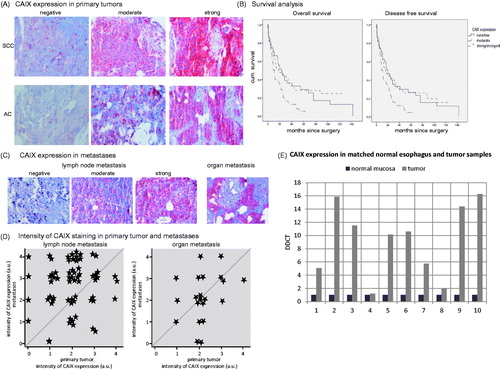
Table 1. Chemical Structures of CAIX Inhibitors.
Table 2. Patient characteristics.
Figure 2. CAIX expression in esophageal carcinoma cell lines. Protein (A) and RNA (B) levels of CAIX expression of esophageal carcinoma cell lines are shown under normoxic and hypoxic conditions. DDTC was calculated using 2^(-Delta Delta C(T)) methodCitation24. (C) Hypoxia-dependent expression of CAIX in PT6216 cells under normoxic and hypoxic conditions with 5%, 2%, and 1% O2 respectively.
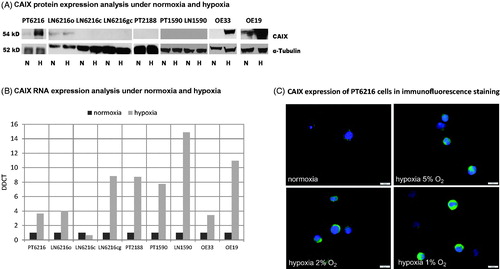
Figure 3. Inhibition of proliferation of esophageal carcinoma cell line PT6216, LN6216c, and PT2188. The specific CAIX inhibitors FC5–207A and FC-8–325A were used to inhibit CAIX in vitro. Significant decreases in proliferation were observed under normoxic and hypoxic conditions for both inhibitors for cell line PT6216 (left panels). Cell lines LN6216c and PT2188 do not express CAIX and neither inhibitor led to a decrease in proliferation, but rather, although this effect was not consistently significant to an increase of proliferation (middle and right panels). Absorbance (AU) is represented on the y-axis.
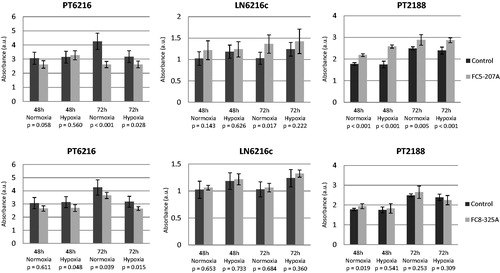
Figure 4. CAIX Knockdown in esophageal carcinoma cell line PT6216. (A) RNA results were verified by analysis of CAIX protein expression. (B) Inhibition of the PT6216 control cells led to a significant decrease of proliferation after 72 h treatment with both inhibitors under hypoxia (upper panels), but was not effective in the equivalent CAIX-knockdown cells (lower panels). Absorbance (AU) is represented on the y-axis.
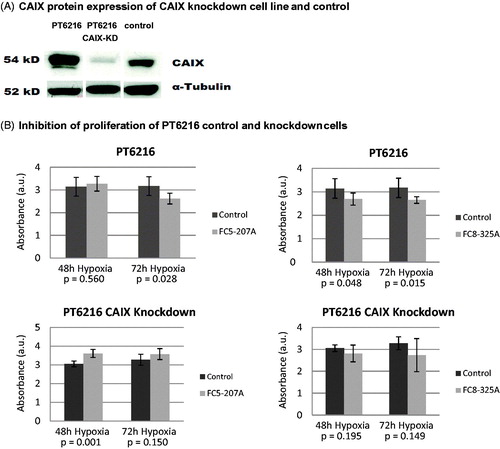
Figure 5. Migration of PT6216 control and knockdown cells in vitro. Migration in vitro assays showed that while regular PT6216 cells migrate under exposure to 2% FCS as chemotactic stimulant the CAIX knockdown cells lost the ability to migrate.
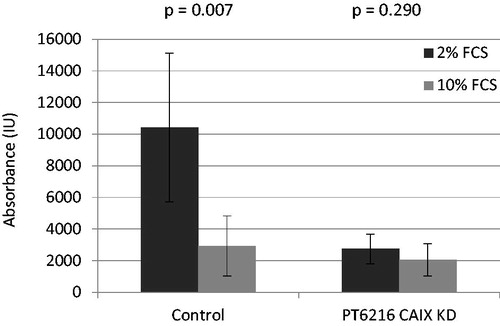
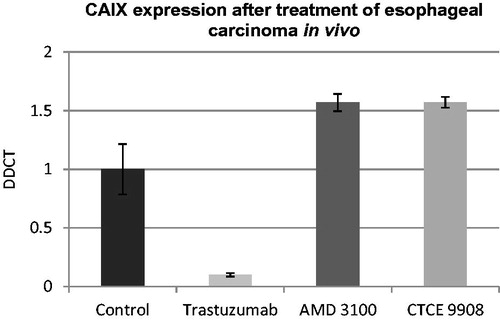
Figure 6. CAIX expression after treatment of esophageal carcinoma in vivo. While treatment showed a significant decrease in tumour progression in all treatment groups, as previously publishedCitation19,Citation20,Citation29, only trastuzumab led to a suppression of CAIX, while treatment with both CXCR4 inhibitors led to an up-regulation of CAIX. Standard deviation was calculated as percent deviation of Delta-CT values.