Figures & data
Figure 1. Structure of hCA II complexed with (A) bisulfite (tetrahedral geometry of Zn(II)), (B) bromide (distorted tetrahedral geometry of Zn(II)), (C) formate (trigonal bipyramidal geometry of Zn(II)) and (D) nitrate (inhibitor non-coordinated to the zinc)Citation10–13. The three protein zinc ligands (His94, 96 and 119) as well as the other two amino acid residues involved in the catalytic mechanism and binding of inhibitors, Glu106 and Thr199, are also evidenced.Citation1,Citation10.
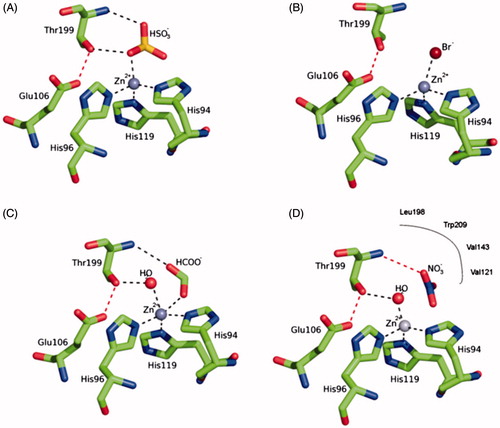
Table 1. Summary of Data Collection and Atomic Model Refinement Statistics.Table Footnotea
Figure 2. Active site of Zn,Cu-hCA II. The zinc ion (gray sphere) is coordinated by His94, His96 and His119 and a O2 molecule. The Cu(II) (orange sphere) bound to His 64 and His4. An omit Fo − Fc electron density map contoured at 3.5 σ level is also shown.
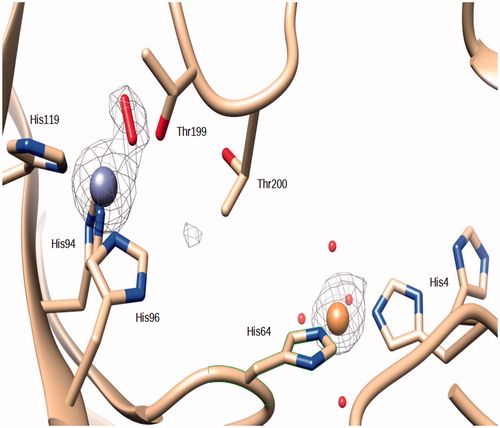
Figure 3. Superposition of the Zn,Cu-hCA II structure (this work) with the copper derivative reported in ref.Citation15. Copper ions are represented as orange spheres, zinc as a gray sphere. It should be observed that the O2 molecules occupy a different position within the coordination sphere of the two hCA II copper derivatives.
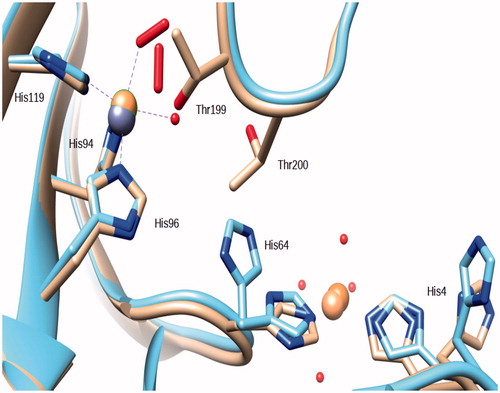
Figure 4. Superposition of the Zn,Cu-hCA II structure (this work) with the native enzyme (PDB ID 2ILI). Zinc ions are represented as gray spheres and water molecues as red spheres (Zn,Cu-hCA II) and orange spheres (native enzyme).
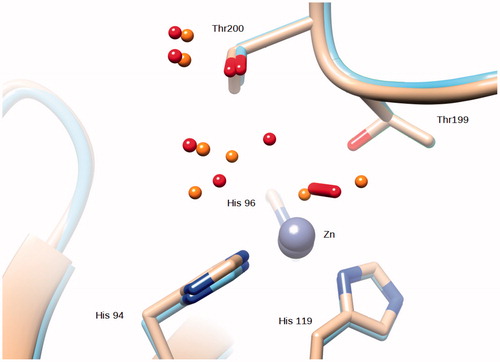
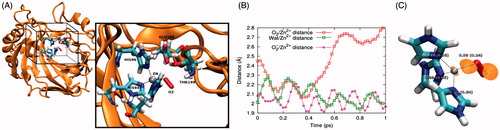
Figure 5. (A) Model used for MD simulations at QM/MM level. Water molecules are included in the calculation but are not shown for clarity. The QM box is reported and QM atoms are explicitly reported in the inset. (B) Time evolution of the O2/Zn2+, Wat/Zn2+ and O2−/Zn2+ distance. Here Wat represents the water molecule displacing O2 from the binding site, as described in the main text. (C) Geometry and bonding features of the complex in the small gas phase model. The numbers represent the bond order obtained by the QTAIM approach. Numbers in brackets and without brackets refer to the O2/Zn2+ and O2−/Zn2+ complex, respectively. The orange surface represents the O2−/Zn2+ complex HOMO density isosurface, computed at a density of 0.05 e−/Å3.