Figures & data
Table 1. Druggable binding sites.
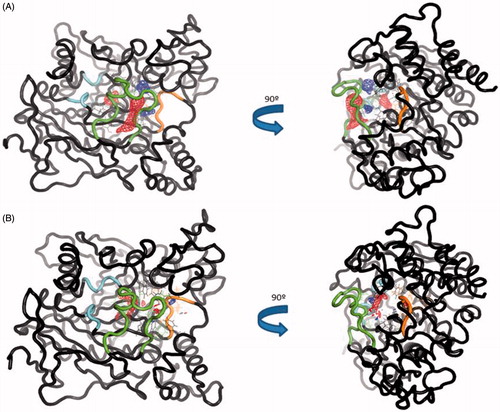
Figure 1. AChE structure highlighting the best cavities found by Fpocket.
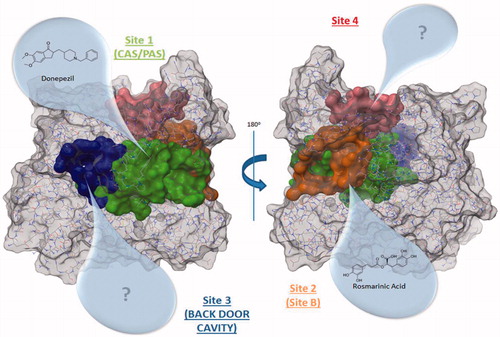
Figure 2. Amino acids involved in site 2 and site 3 found in hAChE (PDB ID: 4EY4). Site 2 residues are shown in orange and site 3 residues are shown in blue.
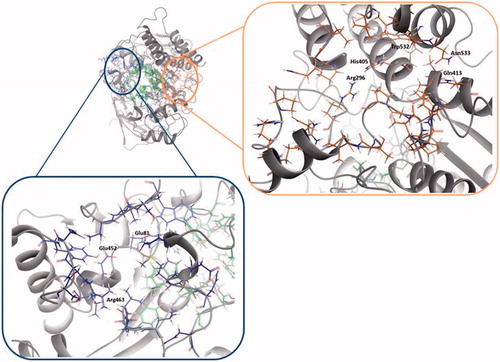
Table 2. Residues of allosteric sites, site 2 and site 3.
Figure 3. (A) Surface representation of pockets that belong to site 2 (orange) and site 3 (blue). Differences between the volume in the absence and presence in the CAS/PAS cavity of inhibitor are highlighted (4EY4 is AChE in the apo state, 4EY7 is AChE crystallised with donepezil). (B) Plots of volume measured in some structures crystallised in the same conditions for site 2 (orange) and site 3 (blue).
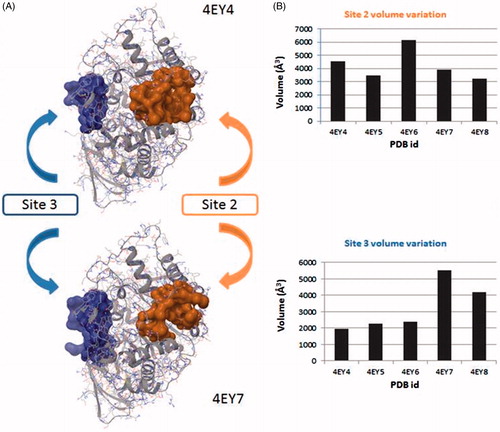
Figure 4. Representation of the calculated hotspots using Fragment Hotspot maps softwareCitation30. Yellow area refers to non-polar area where the ligand should make hydrophobic interactions. Blue dots represent the area where the ligand should make a donor H-bond, and red dots where acceptor H-bond should be formed.
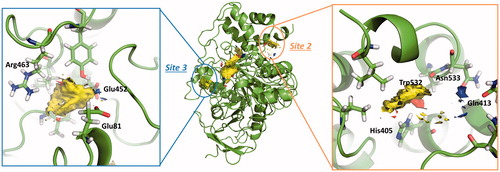
Table 3. Experimental inhibition values of the virtual screening compounds to bind site 2.
Figure 5. Superposition of the proposed pose for SC251 at Site 2 and the hotspot calculated with Fragment Hotspot maps software.
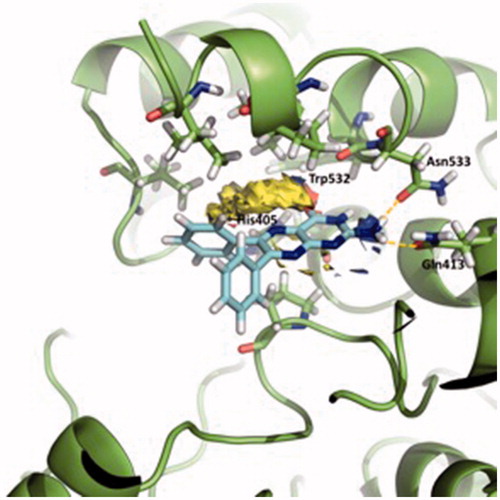
Figure. 6. Lineweaver–Burk plots representing the reciprocal of initial enzyme velocity versus the reciprocal of ACh concentration in the absence and presence of different concentrations of SC251 (1–5 μM). Each point is the mean of three different experiments.
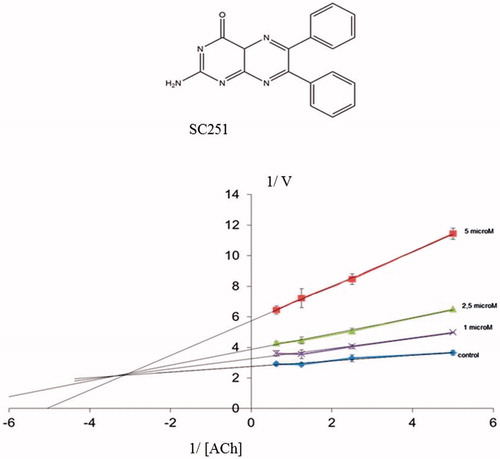
Figure 7. (A) TRAPP analysis for the apo AChE trajectory. (B) TRAPP analysis for the AChE-SC251 trajectory. Blue areas represent disappearing areas at the 50% of the snapshots, red areas represent appearing areas at the 50% of the snapshots. Green loop corresponds to the side door, orange loop to the acyl-loop and the blue residues to the back door.
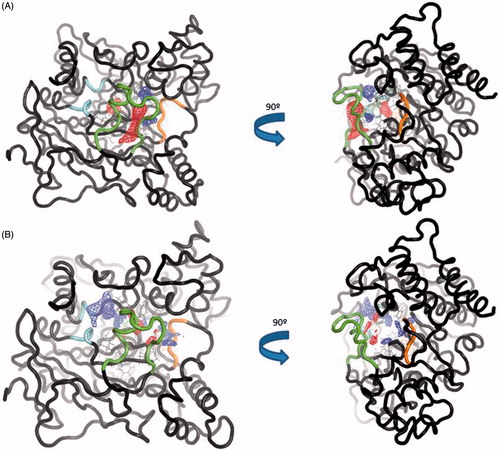
Figure 8. Lineweaver–Burk plots representing the reciprocal of initial enzyme velocity versus the reciprocal of ACh concentration in the absence and presence of different concentrations of VP2.33 and SC035. Each point is the mean of three different experiments.
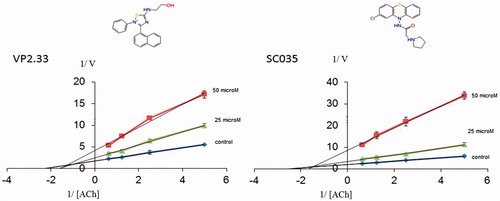
Table 4. Experimental inhibition value of the identified compounds to bind site 3 and binding interactions with AChE.
Table 5. Results of the inhibition of AChE with JTE-907 and VP2.33.
Figure 9. Superimposition of the proposed pose for VP2.33 (blue) (A) and SC035 (orange) (B) at Site 3 and the hotspot calculated with Fragment Hotspot maps software.
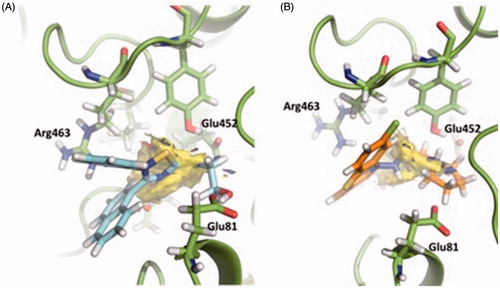
Figure 10. (A) TRAPP analysis for the apo AChE trajectory. (B) TRAPP analysis for the AChE-VP2.33 trajectory. Blue areas represent disappearing areas at the 50% of the snapshots, red areas represent appearing areas at the 50% of the snapshots. Green loop corresponds to the side door, orange loop to the acyl-loop and the blue residues to the back door.