Figures & data
Figure 1. Chemical structures of the compounds used in the study. (A) The nitroimidazole DTP338 (compound 9 in the original study)Citation18 inhibits human CA IX showed inhibition constant Ki 8.3 nM in vitroCitation18. (B) The nitroimidazole DTP348 (compound 7 in original study) inhibitions human of CA IX in vitro at the concentration of 20.4 nMCitation18.
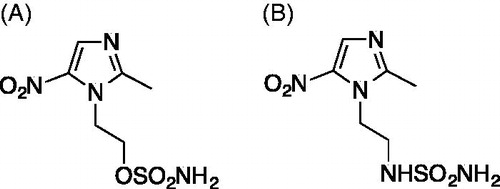
Figure 2. The LD50 determination of nitroimidazole inhibitors. The LD50 dose for the CA IX inhibitors DTP338 and DTP348 was determined based on cumulative mortality of the zebrafish larvae at the end of five days after the exposure of embryos to different concentration of the inhibitors. The LD50 doses for both the DTP338 and DTP348 compounds were in the range of 3.5 mM concentration (A and B). The LD50 were determined after three independent experiments with similar experimental conditions (n 180).
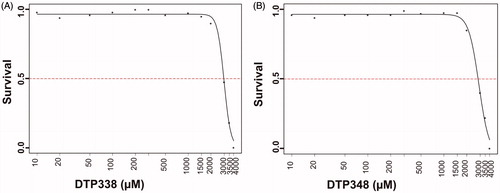
Figure 3. Phenotypic images zebrafish embryos in control and nitroimidazole inhibitor treated groups. Developmental images of 1–5 dpf zebrafish embryos exposed to different concentrations of DTP338 and DTP348. (A) The images of control group (not treated with inhibitors) and 1% DMSO treated zebrafish larvae show normal development. (B) The zebrafish larvae treated with different concentrations (100–500 μM) of DTP338. (C) The images of zebrafish larvae exposed to different concentrations (100–500 μM) of DTP348. The embryos exposed up to 500 μM concentrations show no apparent phenotypic abnormalities at the end of 5 after exposure to the drugs and had normal embryonic development.
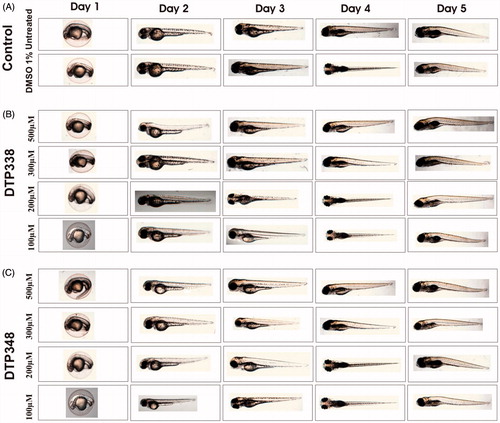
Figure 4. Effect of nitroimidazole inhibitors on phenotypic parameters of the 5 dpf zebrafish embryos. Panel A and B show bar graphs of observable phenotypic parameters (1) swim bladder, (2) body shape, (3) yolk sack, (4) heartbeat and (5) hatching and zebrafish larvae treated with different concentrations of DTP338 (A) and DTP348 (B). In the inhibitor treated groups of both the compounds, the parameters, swim bladder development, body shape, utilization of yolk sack, heartbeat and hatching showed no significant difference compared control group zebrafish larvae. At the end of five days after exposure to inhibitors the zebrafish larvae showed a significant difference in the swim pattern compared to control group larvae. (C) The bar graph panel shows the percent survival of the zebrafish larvae in inhibitor treated group and control group treated with 1% DMSO. For each concentration, n 120. *p < 0.05 by two-tailed Fisher’s test.
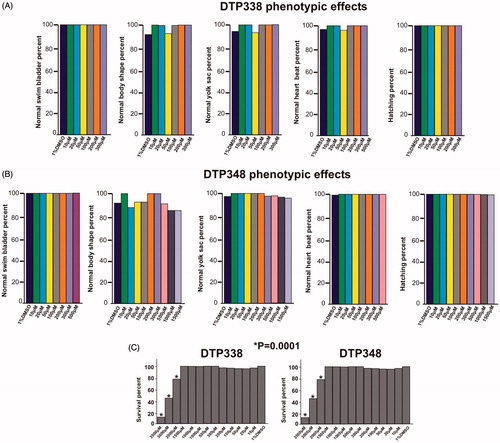
Figure 5. Ataxic swim pattern of the zebrafish larvae. (A) Zebrafish larvae (5 dpf) showing normal swim pattern. (B) The zebrafish larvae treated with 300 μM DTP338 show wobbling movement along the path at the end of five days after exposure to the inhibitor. (C) The zebrafish larvae treated with 300 μM DTP348 also show wobbling movement along the path at the end of fier days after exposure to the inhibitor. The swim pattern of the larvae treated with inhibitors showed difficulty in balancing the body while moving forward with a curve in the body (arrow heads). (D) Shows the bar graph of swim pattern treated with different concentration of nitroimidazoles.
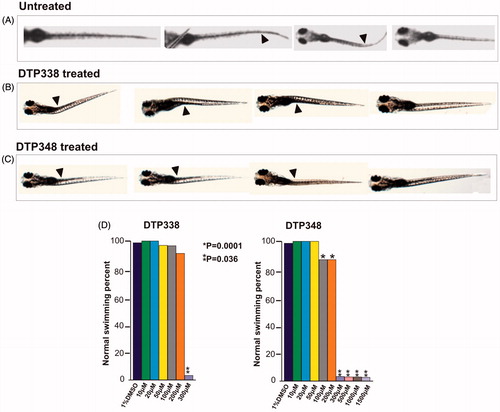
Figure 6. Histochemical images of control group and nitroimidazole inhibitors treated zebrafish larvae. (A) The image of larvae treated with 1% DMSO. (B) The image of zebrafish not treated with any drug. (C) The larvae treated with 2 mM concentration of DTP338. (D) The larvae treated with 500 μM concentration of DTP338. (E) The larvae treated with 2 mM concentration of DTP348. (F) The larvae treated with 500 μM concentration DTP348. The images presented here are selected from three independent groups of experiments. The sagittal sections show no apparent morphological changes or abnormalities in the tissues in the zebrafish larvae at the end of five days of exposure.
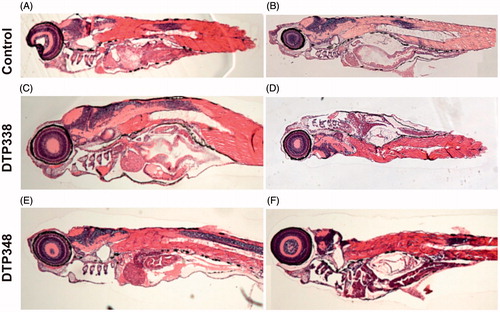
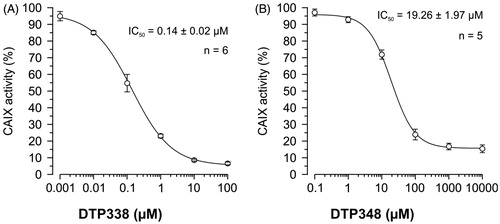
Figure 7. The IC50 doses of the two nitroimidazole compounds. (A) Shows the half maximal inhibition of human CA IX catalytic activity in vivo in Xenopus oocytes exposed to different concentrations of nitroimidazole DTP338. (B) Shows the half maximal inhibition of human CA IX catalytic activity in vivo in Xenopus oocytes exposed to different concentrations of nitroimidazole DTP348. The IC50 values were determined from five to six independent experiments.