Figures & data
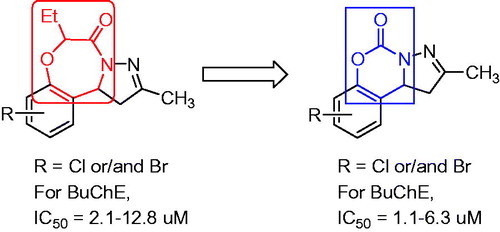
Figure 1. The rational design in this study.
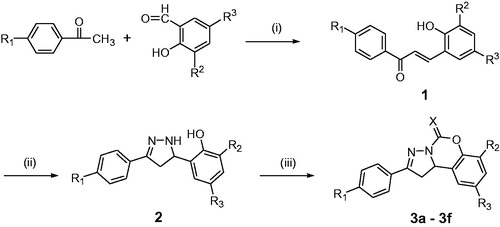
Scheme 1. Synthesis of compounds 3a–3f. Reagents and conditions: (i) 40% NaOH solution, EtOH, 60 °C; (ii) N2H4·H2O, EtOH, reflux; (iii) N,N′-carbonyldiimidazole or 1,1′-thiocarbonyldiimidazole, CH2Cl2, r.t.
Scheme 2. Synthesis of compounds 6a–6q. Reagents and conditions: (iv) 40% NaOH solution, 60 °C; (v) N2H4·H2O, EtOH, reflux; (vi) N,N′-carbonyldiimidazole or 1,1′-thiocarbonyldiimidazole, CH2Cl2, r.t.
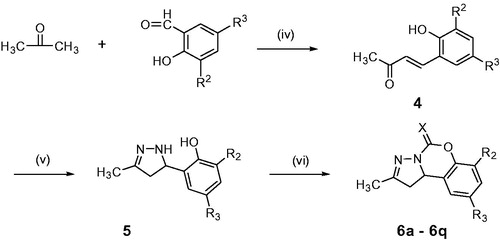
Table 1. Chemical structures of compounds 3a–3f and 6a–6q and their inhibitory activities against EeAChE and eqBuChETable Footnotea
Figure 2. Lineweaver − Burk plots of esBChE inhibition kinetics of compounds 6a (A), 6g (B). The Lineweaver–Burk secondary plots of compounds 6a (C) and 6g (D). Reciprocals of enzyme activity (esBuChE) vs. reciprocals of substrate (butyrylthiocholine iodide) concentration in the presence of different concentrations (0−20 µM) of inhibitor. Inset: Concentrations used for inhibitor are coded with different graphic symbols.
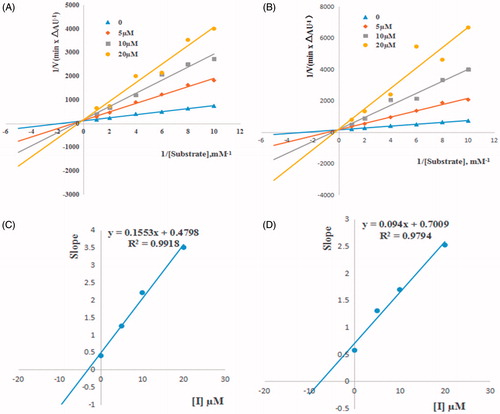
Figure 3. Cytotoxicity of compounds 6a, 6g and donepezil tested at concentrations in the range 1–50 µM in PC12 cell lines for 24 h. Untreated cells were used as control. Results are expressed as percentage of cell survival vs. untreated cell (control) and shown as mean ± SD (n = 3).
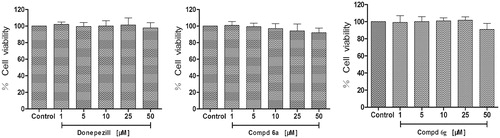
Figure 4. Neuroprotective effect on PC12 cell lines of compounds 6a and 6g. After 24 h incubation at different concentration (25 and 50 µM) with H2O2 (300 µM). Untreated cells were used as control. Results represent mean ± SD (n = 3). Statistical significance was calculated using one-way ANOVA and Bonferroni post hoc tests. ###p < .001 compared with the control group; *p < .05 compared with H2O2 group.
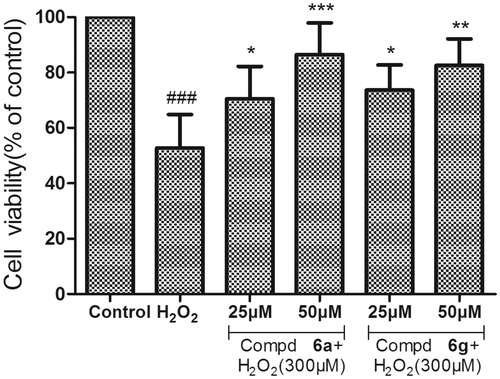
Table 2. -CDOCKER_INTERACTION_ENERGY of title compounds 6a–6q and 1P0I
Figure 5. (A,C) 3D mode of interaction of compounds 6a and 6b and BuChE (PDB code: 1P0I) analysed by Discovery Studio 2017R2. Conventional hydrogen bond and carbon hydrogen bond and alkyl as well as Pi–alkyl are shown by green, light green and pink, respectively. (B,D) Two dimensional mode of interaction of compounds 6a and 6b and BuChE (PDB code: 1P0I) analysed by Discovery Studio 2017R2.
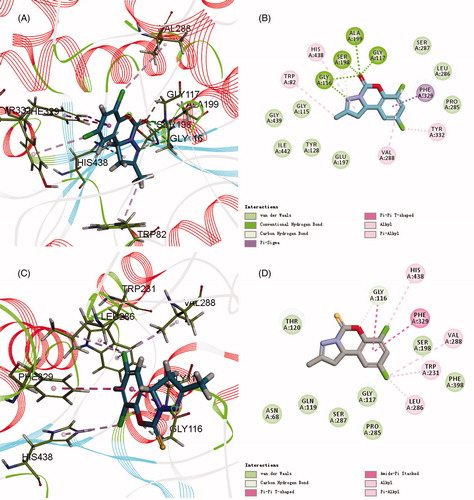
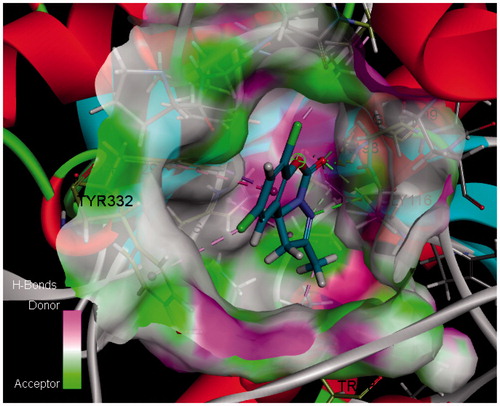
Figure 6. The H-Bonds surface of compound 6a and BuChE (PDB code: 1P0I) analysed by Discovery Studio 2017R2.