Figures & data
Figure 1. The structures of curcumin and some BAPs.
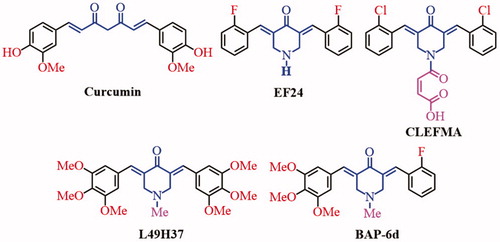
Table 1. Cytotoxicity of BAPs, Curcumin and DOX.
Scheme 1. Synthetic strategy and structures of BAPs.
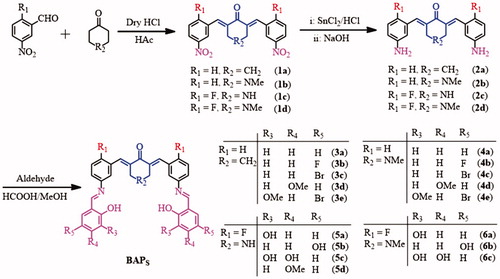
Figure 2. (A) The structures of BAP 5c. (B) Cytotoxicity of BAP 5c. (C) BAP 5c induces HepG2 cells apoptosis. HepG2 cells were incubated with 5c (1.0, 2.0, 4.0 µM) for 24 h and analysed for apoptosis by Annexin V-FITC staining. ***p < .001 vs the negative control. (D) The effect of 5c on the expression level of resistance protein Bax and Bcl-2 detected by western blot. Protein was from HepG2 cell line treated for 3 h by BAP 5c in 1.0, 2.0, 4.0 µM concentrations. The data are representative of three independent experiments. *p < .05, **p < .01, ***p < .001 vs the negative control (one-way ANOVA followed by Dunnett’s test). (E) The molecular docking modes of compound 5c in the active site of Bcl-2 protein.
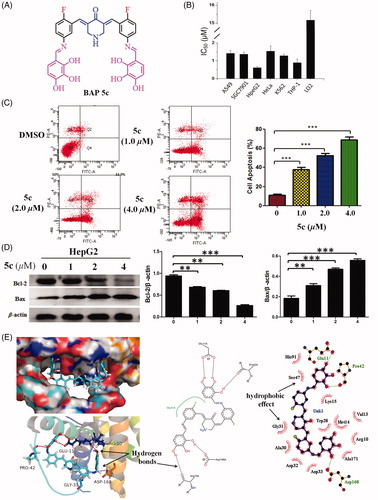
Figure 3. The cellular uptake of BAP 5c in HepG2 cells at different time (1 h, 2 h, 4 h, 8 h) observed by CLSM. Scale bar: 50 µm.
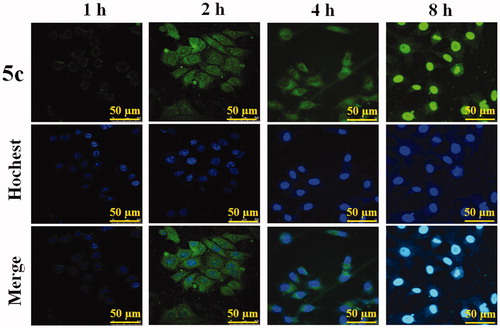
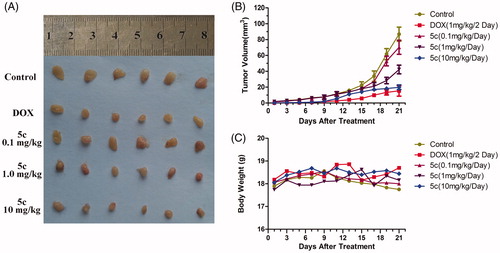
Figure 4. BAP 5c inhibits HepG2 cells growth in vivo. (A) HepG2 cells were injected to the flanks of nude mice were allowed to develop for 3 days. Subsequently, 5c (10 mg/kg, 1.0 mg/kg and 0.1 mg/kg) was injected daily i.p. for up to 20 days. On day 21, tumors were excised and subjected to further analyses. Representative tumors of each group were showed. (B) Tumor sizes were measured every 2 days. (C) Mice body weight was measured every 2 days.