Figures & data
Table 1. Distribution of Helicobacter pylori AdSS between dimeric and monomeric forms, sedimentation coefficients, and molecular masses of these forms, obtained from the analytical ultracentrifugation studies of the apo enzyme, its binary complex with IMP and ternary complex with IMP and hadacidin.
Table 2. Distribution of AdSS between monomeric and dimeric forms observed in the analytical ultracentrifugation studies for various enzyme complexes.
Figure 1. (A) SDS-PAGE of purified H. pylori AdSS, lane 1 – pulled fractions after SEC on Sephacryl S-200 HR, lane 2 – LMW protein markers (molecular masses in kDa given in the figure), lanes 3 & 4 – purified AdSS. (B) Calibration curve for the given gel, Rf is ratio of migration distance of the protein and migration distance of the dye front.
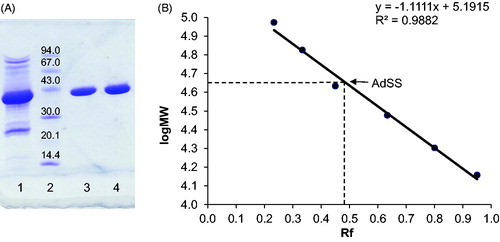
Figure 2. The absorption at 280 nm, A280nm(s), and the interference(s) profiles obtained from fitting the continuous c(s) distribution model to the sedimentation velocity data acquired for Helicobacter pylori AdSS at 20 mM HEPES-NaOH pH 6.8 + 1 mM TCEP, at 20 °C. (A) A280 nm(s) profile for the 4.4 µM of the apo AdSS (black); 4.4 µM AdSS in a binary complex with 0.1 mM IMP (red); and 3.3 µM AdSS in a ternary complex with 0.1 mM IMP and 1 mM hadacidin (blue dashed line) (data normalised). (B) A280 nm(s) (black) and interference(s) (grey dashed line) profiles for the apo enzyme, 5.1 µM (data normalised). (C) Interference(s) profiles for the 5.1 µM AdSS in a binary complex with 3.0 mM IMP (orange); ternary complex with 3 mM IMP and 6 mM GDP, in the presence of 3.3 mM MgSO4 (violet); and quaternary complex with 3.0 mM IMP, 6.0 mM GDP and 5.5 mM hadacidin, in the presence of 3.3 mM MgSO4 (green). Two species with sedimentation coefficients of about 1S and 2S, corresponding to a molecular mass of about 10 and 30 kDa, as observed only in the interference profiles, not in the A280nm profiles (see data on panel B), are therefore probably non-protein contaminants, which is additionally confirmed by the single band observed on the SDS electrophoresis gel (see ).
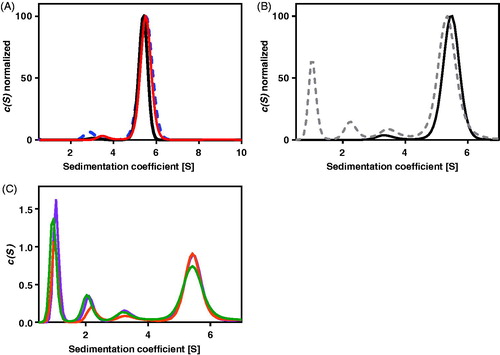
Figure 3. Effect of A) pH, and B) temperature on H. pylori AdSS stability (–▪–) and activity (–▲–). The exact conditions are described in Materials and methods section.
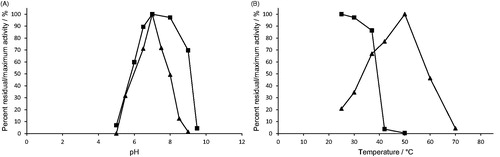
Table 3. Kinetic parameters for H. pylori AdSS, obtained by fitting the Michaelis–Menten equation to the experimental data. Fitting errors of the kinetic parameters obtained are shown in the table.
Figure 4. Inhibition of H. pylori AdSS by hadacidin, at 25 °C, in 20 mM HEPES-NaOH buffer pH 7.7, with Asp as a variable substrate. (A) Initial velocity (v) vs. substrate concentration, for inhibitor concentrations indicated in the figure. (B) The same data shown on the Dixon plot, i.e. reciprocal of the initial velocity (1/v) vs. inhibitor concentration, for substrate concentrations indicated in the figure.
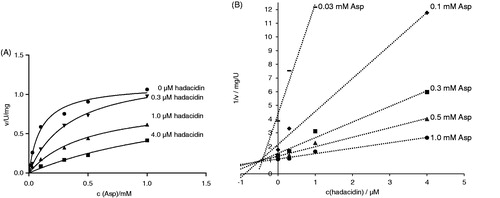
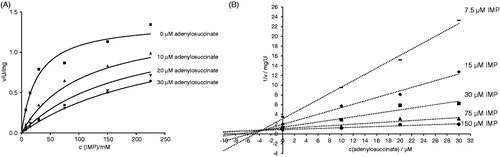
Figure 5. Inhibition of H. pylori AdSS by adenylosuccinate, at 25 °C, in 20 mM HEPES-NaOH buffer pH 7.7, with IMP as a variable substrate. (A) Initial velocity (v) vs. substrate concentration, for inhibitor concentrations indicated in the figure. (B) The same data shown on the Dixon plot, i.e. reciprocal of the initial velocity (1/v) vs. inhibitor concentration, for substrate concentrations indicated in the figure.