Figures & data
Figure 1. The hTopoIIα structures used in the docking study. (A) The ATPase domain of hTopoIIα with the 5′-adenylyl-β,γ-imidodiphosphate, AMP-PNP (space filling model), in the ATP-binding pocket, where the GHKL and transducer domains are shown in green and pink (PDB code: 1ZXM). (B) The hTopoIIα/DNA/etoposide ternary complex (PDB code: 3QX3).
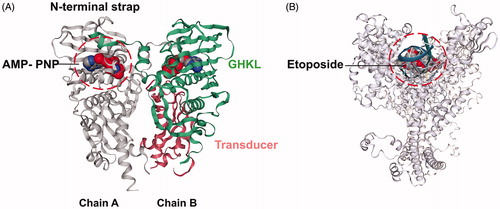
Figure 2. Chemical structure of the 47 designed chalcones from six different groups.
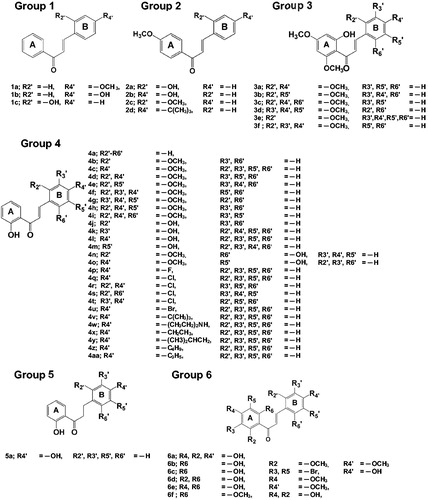
Figure 3. CDOCKER interaction energies (kcal/mol) of the designed chalcone derivatives binding at two different sites relative to the known hTopoIIα inhibitors, salvicine and etoposide.
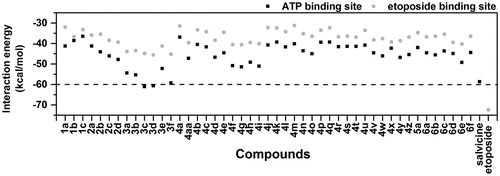
Figure 4. Superimposed structures of the three most active chalcones (3c, 3d and 3f) from the docking study with that of salvicine in the ATP-binding pocket of the hTopoIIα ATPase domain. Figure created by NGL viewer (http://nglviewer.org/ngl/).
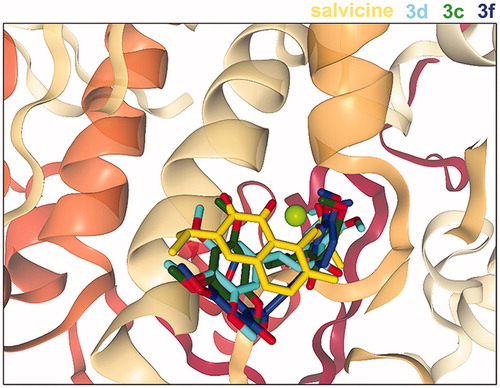
Table 1. Contact residues of the hTopoIIα ATPase domain for the binding of salvicine and three chalcones (3c, 3d and 3f). The residues in bold format stabilise the ligand binding via H-bond interaction, while the conserved residues between each chalcone and salvicine are shown in underlined format.
Table 2. In vitro IC50 values of the three chalcone compounds and salvicine against the HT-1376, HeLa and MCF-7 cancer-derived cell lines and the rhTopoIIα ATPase domain.
Figure 5. (A) SDS–PAGE gel analysis of the enriched rhTopoIIα ATPase domain. Lane M: molecular weight marker of standard protein; Lane 1: enriched rhTopoIIα ATPase domain (45 kDa). (B,C) The IC50 curves of (B) salvicine and (C) 3d against the ATPase activity of rhTopoIIα. Data are shown as the mean ±1 SD, derived from three independent experiments.
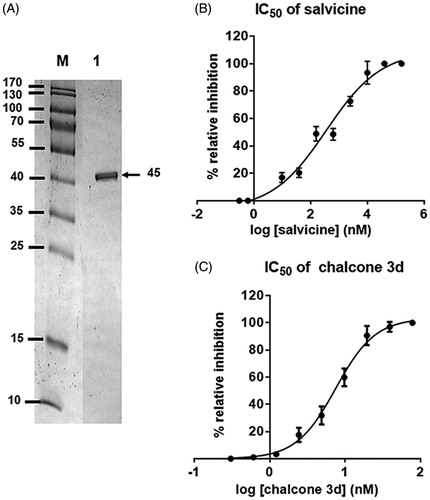
Figure 6. (A) Per-residue decomposition free energy of 3d/hTopoIIα complex and (B) the binding orientation of 3d inside the ATP-binding pocket of ATPase domain, drawn from the last MD snapshot.
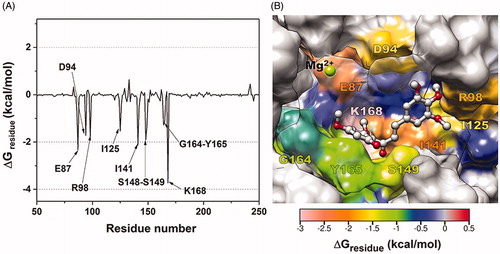
Figure 7. (Top) Per-residue decomposition free energy of the 10 key residues (black) and their contribution from backbone (dark gray) and side chain (light gray). (Bottom) The vdW (EvdW + Gnonpolar) and electrostatic (Eele + Gpolar) energy contributions are given in black and gray lines, respectively.
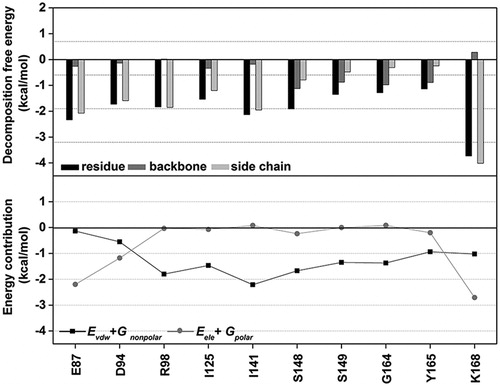
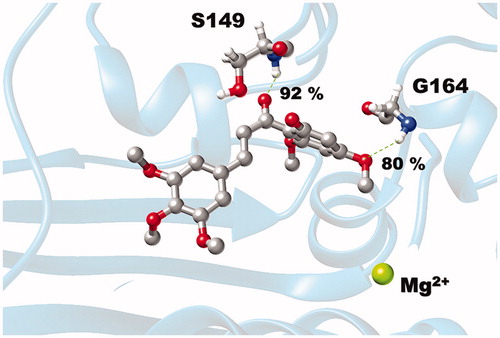
Figure 8. Hydrogen bond formation between chalcone 3d and the two residues in the ATP-binding pocket of hTopoIIα ATPase domain, where the percentage of H-bond occupation is also given.