
Figures & data
Table 1. Structural formulas and inhibitory activities for the investigated disaccharide nucleosides.
Figure 1. The main structural blocks of the single-stranded (A) and the hairpin (B) oligonucleotides.
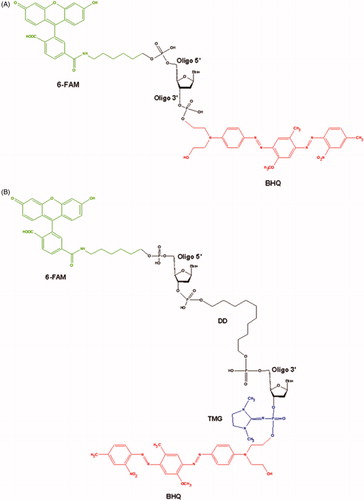
Table 2. Cytotoxicity of inhibitors, topotecan and their combination for A-549 and WI-38 cell lines.
Figure 2. Topotecan dose-dependent action of the disaccharide nucleosides on A-549 (A) and WI-38 (B) viability according to the MTT-assay. Average data with error bars from three independent experiments.
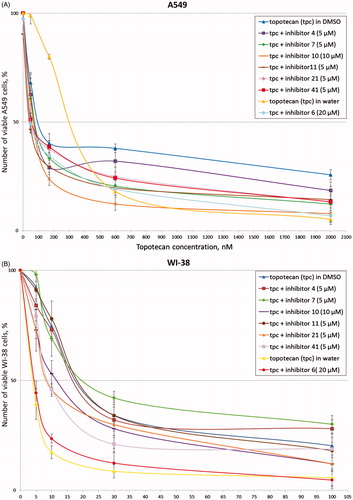
Figure 3. (A) TDP1 reaction scheme with single-stranded biosensor. (B) Gel pictures of the TDP1 reaction products. The arrows indicate the positions of the initial substrate and the reaction product. Concentration of TDP1 was 1.5 nM, concentration of single-stranded substrate was 50 nM, and reaction time was 20 min.
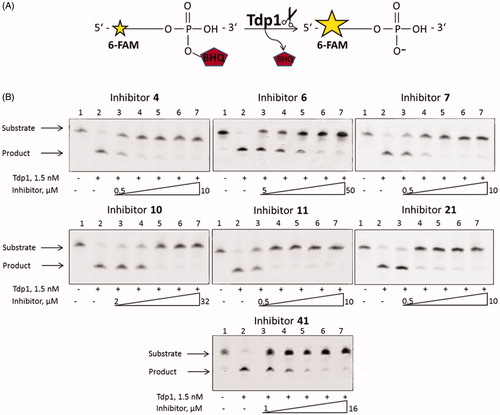
Figure 4. The dependence of fluorescence anisotropy on inhibitor concentration (A) for inhibitors 4, 7, 10, 11, 21; (B) for inhibitors 6, 41. Average data with error bars from two independent experiments.
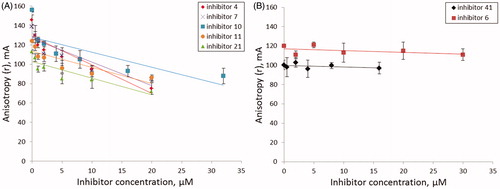
Figure 5. TDP1 action and possible inhibition strategies. Yellow shape represents TDP1; pentagon represents Top1 residue in vivo or BHQ in this study.
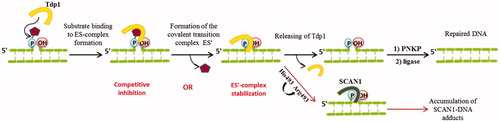
Figure 6. (A) Dependence of Vmax on the concentration of inhibitor 41. (B) Dependence of KM on the concentration of inhibitor 41.
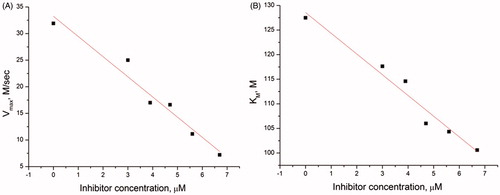
Table 3. IC50 values for selected inhibitors obtained on single-stranded and hairpin substrates.
Table 4. Type of inhibition and values of inhibition constant (KI) for selected inhibitors.