Figures & data
Figure 1. The structures of resveratrol, compound 3, CA-4, colchicine, and the design of target compounds 6a-h, 7a-c, 13a-d, and 14a-b.
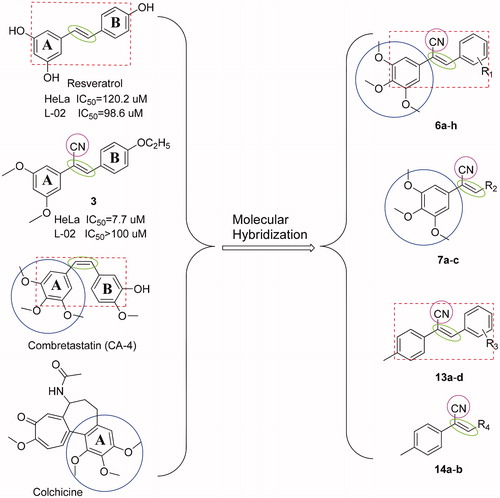
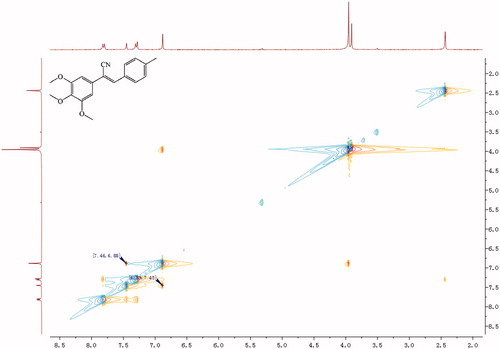
Figure 2. NOE (nuclear overhauser effect) result of compound 6h.
Scheme 1. Reagents and conditions: (a) (CH3)2SO4, (CH3)2CO, K2CO3, reflux; (b) LiAlH4, THF, 0 °C-rt, 4–6 h; (c) CH2Cl2, PBr3, 0 °C-rt, 3–6 h; (d) CH3CN, TMSCN, TBAF, reflux, 4–6 h; (e) CH3OH, CH3ONa, aromatic aldehydes, 4–6 h.
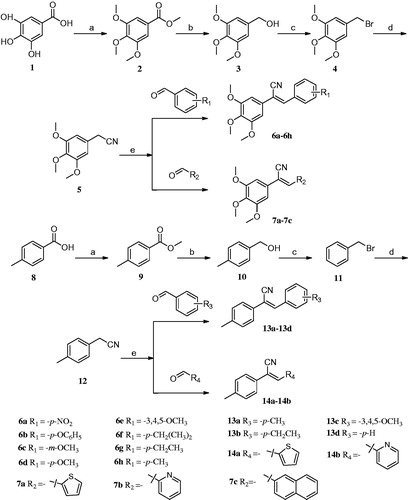
Table 1. In vitro anti-proliferative activity of the synthesised compounds, CA-4, CA-4P, and taxol against eleven cell linesTable Footnotea (IC50 (µMTable Footnoteb))
Table 2. Selectivity index values of compounds relative to the effects on normal cell L-02 or MCF-10A cells.
Figure 3. Compound 6h decreases the expression of cyclin A and cyclin D1 and increases the expression of cyclin B1, thus reducing the cell cycle progression of BEL-7402 cells. (A) Cell numbers in the phases of the cell cycle were analyzed on 12 h after stimulation. Values were obtained from three separate experiments and represent the mean ± SD. *p < 0.05. **p < 0.01. ***p < 0.001 compared to respective control group. (B) Immunoblots were probed using antibodies directed against cyclin A, B1, and D1, and β-actin. Whole-cell protein lysates were extracted from BEL-7402 cells cultured after 12 h. Results are representative of three separate experiments.
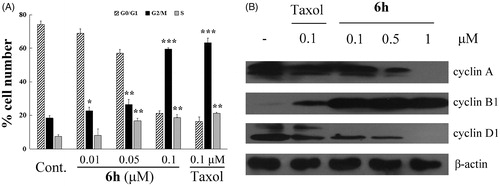
Figure 4. Apoptosis induction in BEL-7402 cells after treatment for 12 h with (A) 0.1% DMSO (vehicle); (B) 0.01 μM 6h; (C) 0.1 μM 6h; (D) 0.1 μM taxol. (E) The results of the cell apoptosis.
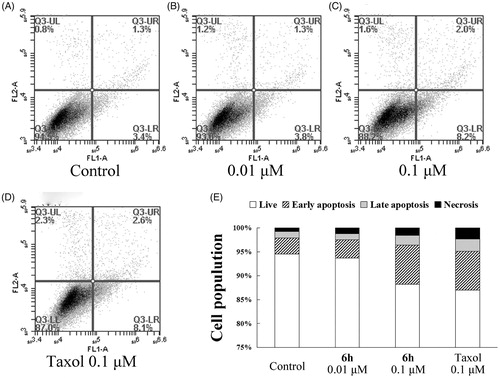
Figure 5. Transwell assay of compound 6h showing inhibition of BEL-7402 cell migration. (A) The images of stained BEL-7402 cells adhering in the lower layer of insert of transwell with phase-contrast microscopy (200× magnification). (B) The relative migration ratio of BEL-7402 cells. Data expressed as mean ± SD (n ≥ 3). ***p < 0.001 compared to control group.
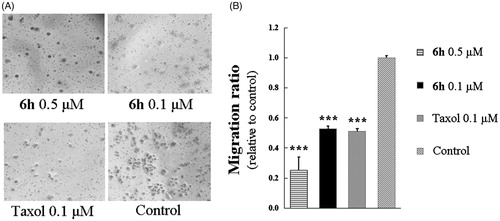
Figure 6. Colony formation ability was inhibited by 6h treatment. (A) The images of stained colonies under phase-contrast microscopy. (B) The curve was fitted as the inhibition ratio of colony formation against the concentration. Values are represented as mean ± SD from three independent colony formation experiments.
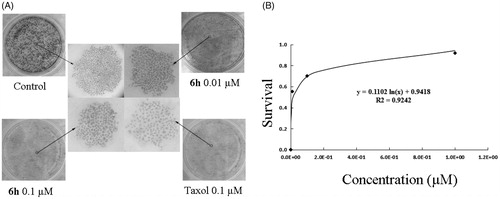
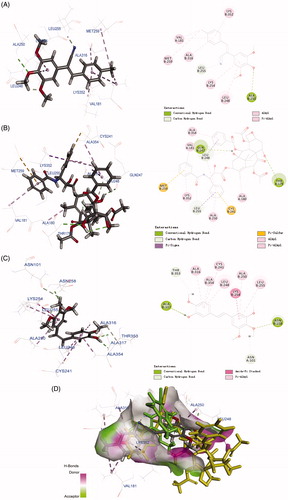
Figure 7. Molecular modelling of compounds in complex with tubulin (PDB: 1SA0). Shown is the proposed binding mode and interaction between tubulin and selected compounds. (A) 6h, (B) taxol, and (C) CA-4. The compounds and important amino acids in the binding pockets are shown in stick model. (D) Superposition of 6h, taxol, and CA-4 in the pocket of tubulin in surface representation. The compounds are shown in stick model with carbon atoms in grey (6h), yellow-green (taxol), or green (CA-4).