Figures & data
Figure 1. SLC-0111 sensitises melanoma cells to Dacarbazine and Temozolomide treatment. (a) Representative plots of Annexin V/PI assay of A375-M6 treated for 96 h with either 50 µM Dacarbazine, or 100 µM SLC-0111, or the combination of the two (lower) and relative quantification chart of early apoptosis, late apoptosis and necrosis ratio (upper). ***p < 0.001 Two-way ANOVA, N = 3. (b) Representative plots of Annexin V/PI assay of A375-M6 treated for 72 h with either 170 µM Temozolomide, or 100 µM SLC-0111, or the combination of the two (lower), and relative quantification chart of early apoptosis, late apoptosis, and necrosis ratio (upper). ***p < 0.001 Two-way ANOVA, N = 3. (c) Quantification chart of Trypan Blue exclusion assay of A375-M6 treated for 72 h with either 170 µM Temozolomide, or 100 µM SLC-0111, or the combination of the two. ***p < 0.001 One-way ANOVA, N = 3. (d) Quantification chart (upper) and representative image (lower) of western blot analysis of cleaved caspase 3 of A375-M6 treated 72 h with 170 µM Temozolomide and 100 µM SLC-0111 alone or combined. Tubulin used as loading control. ***p < 0.001, Two-way ANOVA, N = 3. (e) Quantification chart (upper) and representative pictures (lower) of colony formation assay of A375-M6 treated for 14 days with 170 µM Temozolomide and 100 µM SLC-0111 alone or in combination. *p < 0.05, One-way ANOVA, N = 3. (f) Chemical structure of SLC-0111.
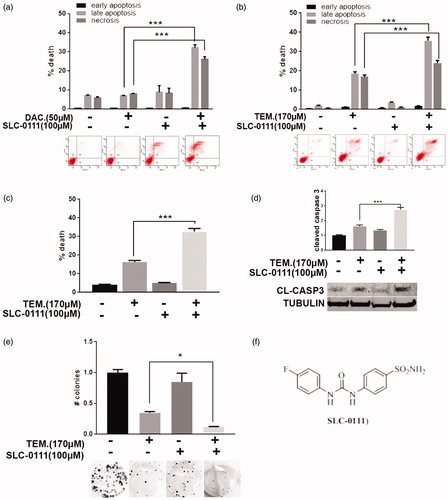
Figure 2. SLC-0111 increases cytotoxic effect of Doxorubicin in breast cancer cells. (a) Representative plots (lower) and relative quantification chart (upper) of Annexin V/PI assay of MCF7 treated for 48 h with either 90 nM Doxorubicin, or 100 µM SLC-0111, or the combination of the two. *p < 0.05, Two-way ANOVA, N = 3. (b) Quantification chart of Trypan Blue exclusion assay of MCF7 treated for 48 h with either 90 nM Doxorubicin, or 100 µM SLC-0111, or the combination of the two. ***p < 0.001 One-way ANOVA, N = 3. (c) Representative pictures (lower) and relative quantification chart (upper) of colony formation assay of MCF7 breast cancer cells treated for 14 days with either 10 nM Doxorubicin, or 100 µM SLC-0111, or the combination of the two. **p < 0.01, One-way ANOVA, N = 3.
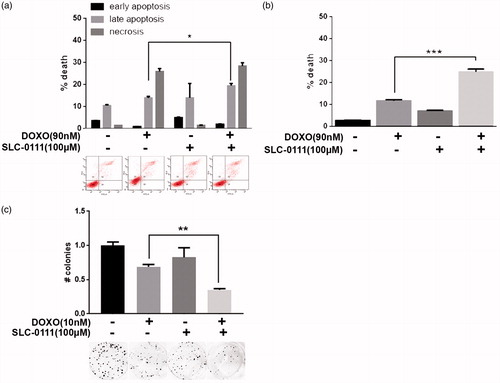
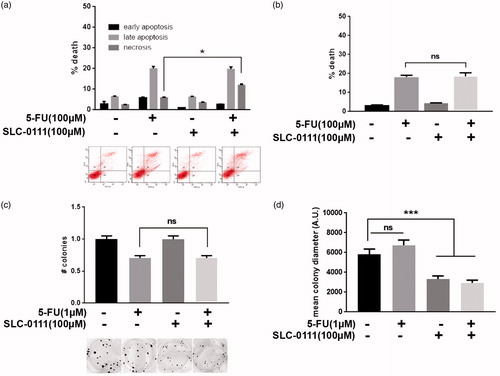
Figure 3. SLC-0111 increases 5-Fluorouracil response in colorectal cancer by reducing cell proliferation. (a) Representative plots (lower) and relative quantification chart (upper) of Annexin V/PI assay of HCT116 treated for 24 h with either 100 µM 5-Fluorouracil, or 100 µM SLC-0111, or the combination of the two. *p < 0.05, Two-way ANOVA, N = 3. (b) Quantification chart of Trypan Blue exclusion assay of HCT116 treated for 24 h with either 100 µM 5-Fluorouracil, or 100 µM SLC-0111, or the combination of the two. One-way ANOVA, N = 3. (c) Representative pictures (lower) and relative quantification chart (upper) of colony formation assay of HCT116 colorectal cancer cells treated for 14 days with either 1 µM 5-Fluorouracil, or 100 µM SLC-0111, or the combination of the two. One-way ANOVA, N = 3. (d) Quantification chart of the diameter mean of HCT116 colonies grown and treated for 14 days with either 1 µM 5-Fluorouracil, or 100 µM SLC-0111, or the combination of the two. ***p < 0.001, One-way ANOVA, N = 3.