Figures & data
Figure 1. Confocal microscopy analysis of CA IX expression in LNCaP cell line cultured at pH 7.4 and pH 6.5. (a)LNCaP cells cultured at pH 7.4 showed low expression of CA IX (green signal) predominately nuclear (blue signal of DAPI). (b) CA IX expression in LNCaP pH 6.5 is higher compared to pH 7.4 and showed a strong cytoplasmic expression.
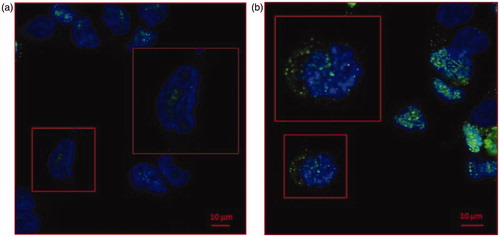
Figure 2. Western Blot of lysates from LNCaP pH 7.4 and LNCaP pH 6.5 cell and exosomes. CA IX expression was analysed in LNCaP lysates from cells and exosomes cultured at different condition. CA IX expression in increased both in cells and exosomes cultured at pH 6.5 compared to samples at pH 7.4. In particular, there is an increase of CA IX 54KDa band in samples at pH 6.5. Membranes were also incubated with anti-GAPDH, a housekeeping protein, and anti-Tsg101, a typical exosomal marker.
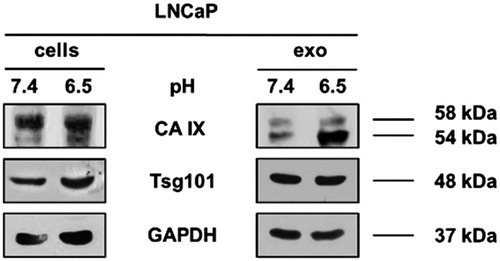
Figure 3. Analysis of CAIX enzymatic activity. CA IX activity is shown for LNCaP cells and their exosomes (ExoLNCaP) obtained from cellular cultures grown at pH 6.5 and 7.4. The results reflect a mean of three independent experiments.
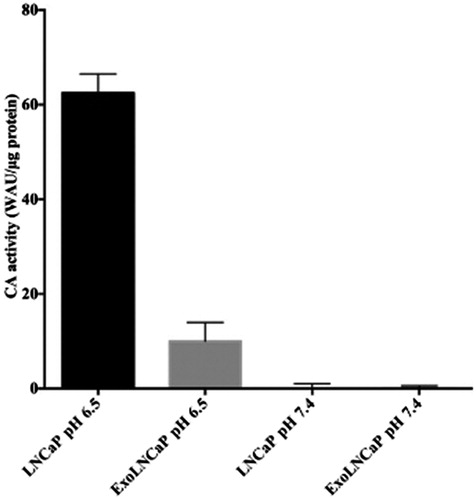
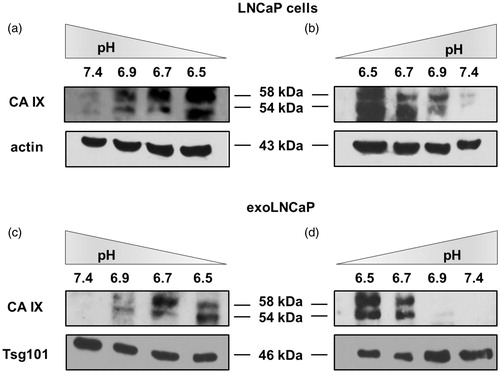
Figure 4. CA IX expression is related to microenvironmental pH. (a) Cells gradually cultured from pH 7.4 to 6.5 showed an increased CA IX expression. (b) CA IX decreased expression in LNCAP cells from pH 6.5 to 7.4. (c) Exosomes isolated from cells cultured from pH 7.4 to 6.5 showed an increased CA IX expression. (d) Exosomes isolated from cells cultured from pH 6.5 to 7.4 showed a decreased CA IX expression.