
Figures & data
Figure 1. pH balance of the skeletal muscle and the involvement of blood CAs in the process.
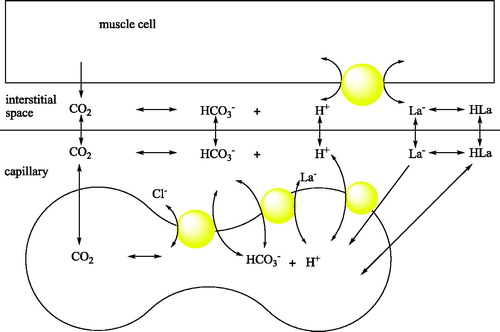
Figure 2. Interval training graph. 1: control, 2: 1st week before training, 3: 1st week after training, 4: 2nd week after training, 5: 4th week after training, 6: 6th week after training.
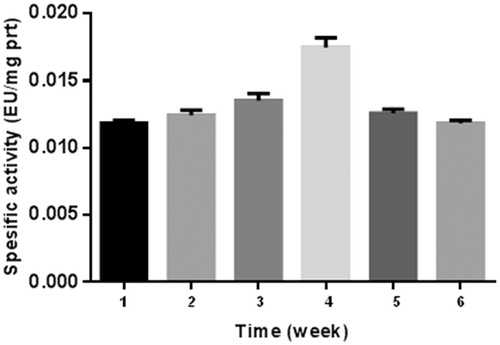
Figure 3. Continuous training graph. 1: control, 2: 1st week before training, 3: 1st week after training, 4: 2nd week after training, 5: 4th week after training, 6: 6th week after training.
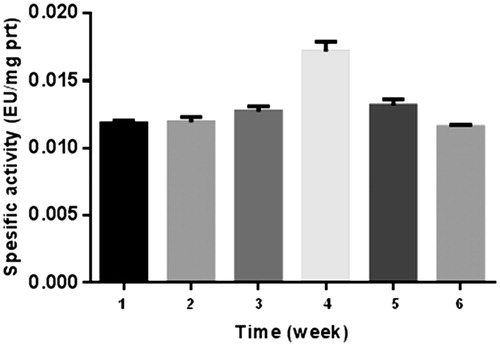
Table 1. Erytrocytes carbonic anhydrase spesific activity results for control, interval and continuous tarining.
Table 2. Interval running group (IRG), continuous running group (CRG) and control group (CG).