Figures & data
Figure 1. Action of the inhibitors on the hydrolysis of sphingomyelin by sphingomyelinase D. Samples of sphingomyelin (68 μM) were incubated for 30 min at 37° C with 5 μg of SMase D, previously incubated or not with 5 to 150 μg (5.8 × 10⁻⁵ to 9.2 × 10⁻⁴ M) of each inhibitor. Alternatively, samples of sphingomyelin with 10 μg of Loxosceles venom, previously incubated or not with 20 μg of each inhibitor. The release of choline, with consequent oxidation to betaine and H2O2, was determined in a fluorimeter and the hydrolysis expressed in arbitrary units of fluorescence. (A) Inhibition of the recombinant SMase D activity. (B) Inhibition of the sphingomyelinase activity of L. laeta venom. Data are expressed as percent inhibition of activity and they are represented as mean ± SEM of duplicates from three independent experiments. The graphs were built using GraFit software version 5.0.6.
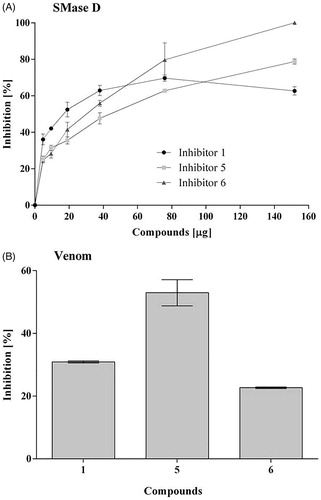
Table 1. Goldscore values presented by the fourteen compounds tested.
Table 2. Virtual docking-based screening findings for the three more promising Loxosceles SMase D inhibitors (five conformations of each compound), using CLC Drug Discovery Workbench software 2.4 (QIAGEN Aarhus A/S, 2014).
Figure 2. Mechanism of inhibition of compounds 1, 5 and 6 on the hydrolytic activity of SMase D on the sphingomyelin substrate. In these assays, four substrate concentrations (0.058 to 0.230 μM) were used, the enzyme concentration was kept fixed at 0.5 μg and the inhibitors were used at concentrations of 0.125 and 0.250 μM. The release of choline, with consequent oxidation to betaine and H2O2, was determined in a fluorimeter and the hydrolysis expressed in arbitrary fluorescence units as in the sphingomyelin hydrolysis assay. Data are expressed as mean ± standard error of triplicates representative of three independent experiments. For analysis, the Linewarver-burk plots method was used and the plots were build using GraFit software version 5.0.6.
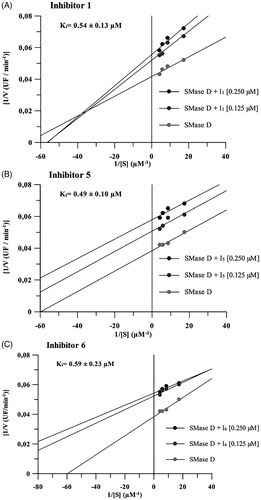
Table 3. List of the complementary amino acid residues which establish interactions with the three more promising inhibitors into the Loxosceles SMase D binding site, according to the findings from molecular docking simulations (CLC Drug Discovery Workbench Software 2.4 (QIAGEN Aarhus A/S, 2014).
Figure 3. The ability of the compounds to inhibit the binding of SMases D to the surface of erythrocytes and to induce the cleavage of glycophorin C (GPC). Human erythrocytes were treated with 2.5 μg of the L. laeta venom incubated or not with 20 μg of each inhibitor and analysed for the expression of GPC by flow cytometry. The ability of the toxins to bind to the surface of the erythrocytes was analysed using a rabbit monospecific polyclonal serum against L. intermedia SMases D. (A) Binding of SMase D on the surface of human erythrocytes. (B) Removal of GPC induced by L. laeta venom. Data are presented as mean ± SEM of duplicates representative of two independent experiments. The statistical analyse was performed by One-Way ANOVA followed by Tukey HSD test. (*)Significant difference in relation to the buffer (p < .05). (#) Significant difference in relation to L. laeta venom (p < .05).
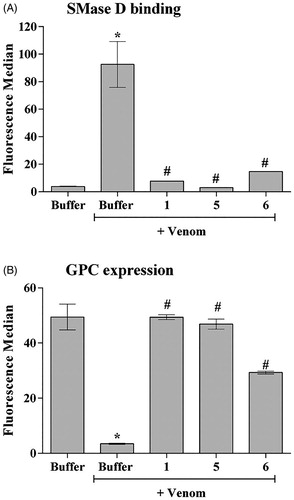
Figure 4. SMase D binding and cell death of human keratinocytes induced by Loxosceles venom. HaCaT cells (5 × 10⁴/well) were treated with 10 μg of L. laeta venom, preincubated or not with each inhibitor to evaluate cell death, binding of the SMase D to the keratinocyte cell membrane and secretion of MMP-2 and MMP-9. Cell death was evaluated after 72 h of incubation by the MTT method. The ability of the toxins to bind to the surface of keratinocytes was analysed by flow cytometry using a horse polyclonal serum against L. intermedia SMases D. Detection of MMP-2 and 9 was performed using Calbiochem MMP- 2 and 9 ELISA Kits. Data are represented as mean ± SEM of duplicates representative of three independent experiments. Statistically analysed by One-Way ANOVA followed by Tukey HSD test. (*)Significant difference in relation to the buffer (p < .05); (#) Significant difference in relation to the venom (p < .05).
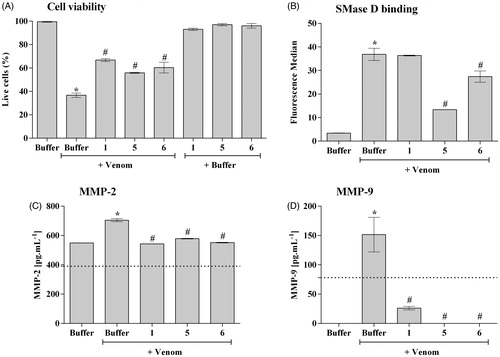
Figure 5. Action of inhibitors on dermonecrosis induced by Loxosceles venom in vivo. (A) Animals were inoculated intradermally with 5 μg of L. laeta venom in the presence or absence of inhibitors 1, 5 or 6 at the concentration of 1 µg, respectively. (B, C) Animals were inoculated intradermally with 5 μg of L. laeta venom in the presence or absence of inhibitor 5 (0.5, 1.0, 1.5 µg) or 6 (0.7, 1.4, 2.0 µg). Sterile saline solution, venom incubated with the same proportion of DMSO present in the inhibitors, only DMSO or only inhibitors were used as controls. The area of the dermonecrotic lesion was measured at 24, 48 and 72 h. Data are represented as mean ± SEM of duplicates of two independent experiments (n = 12 rabbits/group). Results statistically analysed by Two Way ANOVA followed by Bonferroni post-test. (*)Significant difference in relation to venom at the indicated time (p < .05); (**) p < .01; (***) p < .001.
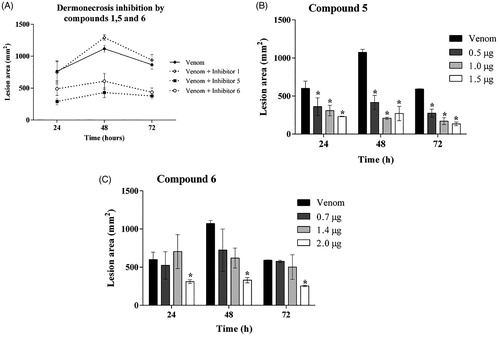
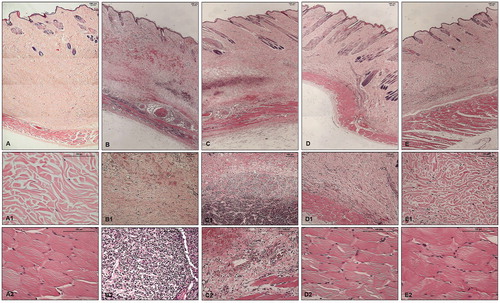
Figure 6. Histopathological analysis of skin fragments from rabbits inoculated with PBS, Loxosceles venom in the presence or absence of inhibitors 1, 5 or 6. Rabbit skin fragments inoculated with PBS, 5 μg of L. laeta venom in the absence or presence of inhibitors 1, 5 or 6 (1 μg), were removed 72 h after inoculation and fixed in 4% formaldehyde pH 7.4. Samples were submitted to the preparation of permanent histological slides stained with Hematoxylin-Eosin. (A) General appearance of the skin fragment inoculated with PBS (5× magnification). (A1) Detail of the collagenous area of the normal dermis (20× magnification). (A2) Detail of the normal adjacent muscular layer (20× magnification). (B) General appearance of the skin fragment inoculated with 5 μg of L. laeta venom in the absence of inhibitors (5× magnification). (B1) Detail of haemorrhagic areas and collagen disorganisation (10× magnification). (B2) Detail of the presence of dense inflammatory infiltrate in tissue (40× magnification). (C) General appearance of the skin fragment inoculated with venom in the presence of inhibitor 1 (5× magnification). (C1) Detail of the presence of inflammatory infiltrate and haemorrhagic areas in the tissue (10× magnification). (C2) Detail of the disorganisation of collagen fibres and haemorrhagic areas near the adjacent muscular layer (20× magnification). (D) General appearance of the skin fragment inoculated with venom in the presence of inhibitor 5 (5× magnification). (D1) Detail of reduced collagen disorganisation, absence of haemorrhagic areas and inflammatory infiltrate (10× magnification). (D2) Detail of the adjacent muscular layer (40× magnification). (E) General appearance of the skin fragment inoculated with venom in the presence of inhibitor 6 (5× magnification). (E1) Detail of reduced collagen disorganisation, absence of haemorrhagic areas and inflammatory infiltrate (20× magnification). (E2) Detail of the adjacent muscular layer (40× magnification). The slides were analysed and photographed using a Leica DM2500 microscope with the aid of Leica QWin Plus Y2.8 software.