
Figures & data
Scheme 1. General structure showing the chemical modification made and synthesis of 4-(3-nitrophenyl)thiazol-2-ylhydrazone derivatives 1–36 and 4–(3-aminophenyl)thiazol-2-ylhydrazone derivative 37.
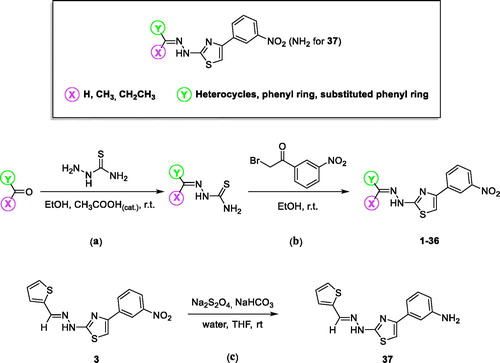
Table 1. Inhibitory activity (IC50) and selectivity index (SI) of compounds 1–35 towards hMAO-A and hMAO-B.
Table 2. Inhibitory activity (IC50) and selectivity index (SI) of compounds 36 and 37 towards hMAO-A and hMAO-B.
Figure 1. Reversibility of the inhibition of hMAO-B by 4. hMAO-B and 4 (at 4 × IC50) were preincubated for 15 min, dialyzed for 24 h and the residual enzyme activity was measured (4, dialyzed). hMAO-B was similarly preincubated in the absence (No Inh, dialyzed) and presence of the irreversible inhibitor, (R)-(−)-deprenyl (depr, dialyzed), and dialyzed. For comparison, the residual hMAO activity of undialysed mixtures of hMAO-B with 4 is also shown (4, not dialyzed).
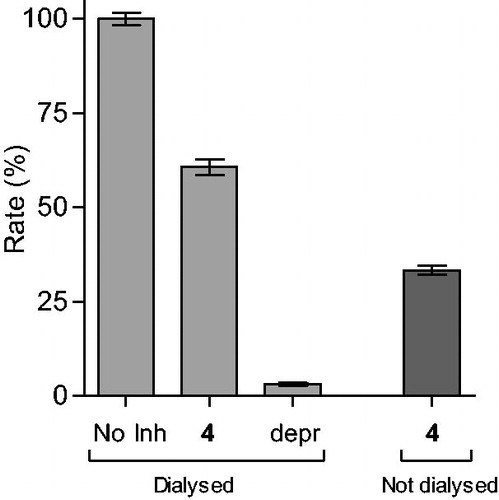
Figure 2. Reversibility of the inhibition of hMAO-B by 37. hMAO-B and 37 (at 4 × IC50) were preincubated for 15 min, dialyzed for 24 h and the residual enzyme activity was measured (37, dialyzed). hMAO-B was similarly preincubated in the absence (No Inh, dialyzed) and presence of the irreversible inhibitor, (R)-(−)-deprenyl (depr, dialyzed), and dialyzed. For comparison, the residual hMAO activity of undialysed mixtures of hMAO-B with 37 is also shown (37, not dialyzed).
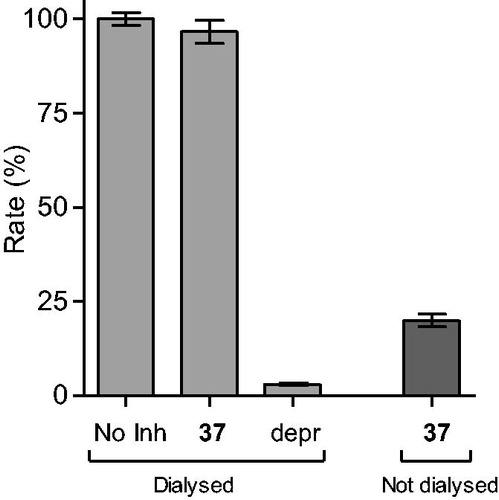
Figure 3. Lineweaver–Burk plots of hMAO-B activities in the absence (filled squares) and presence of various concentrations of compound 4 (IC50 = 0.0018 μM). For these studies the concentrations of compound 4 employed were ¼ × IC50, ½ × IC50, ¾ × IC50, 1 × IC50 and 1¼ × IC50. The inset is a graph of the slopes of the Lineweaver–Burk plots versus inhibitor concentration (Ki = 0.0026 μM).
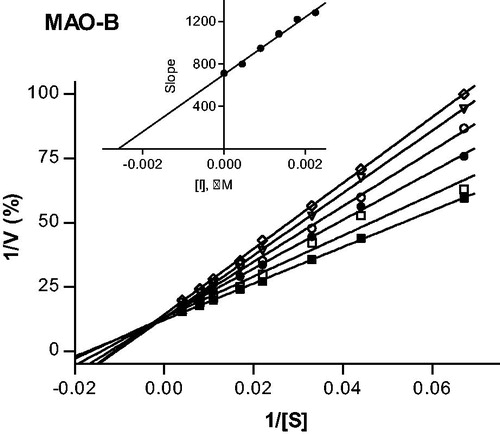
Figure 4. Lineweaver–Burk plots of hMAO-B activities in the absence (filled squares) and presence of various concentrations of compound 37 (IC50 = 2.67 μM). For these studies the concentrations of compound 37 employed were: ¼ × IC50, ½ × IC50, ¾ × IC50, 1 × IC50 and 1¼ × IC50. The inset is a graph of the slopes of the Lineweaver–Burk plots versus inhibitor concentration (Ki = 1.84 μM).
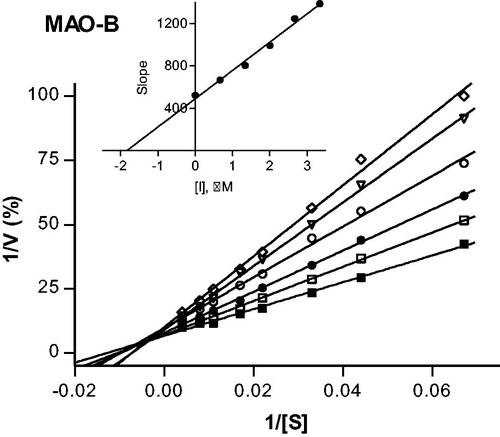
Table 3. Antioxidant and chelating activities of the most promising derivatives compared to the reference drugs, EDTA and trolox.
Scheme 2. The proposed mechanism for the antioxidant ability of compounds 1–37.
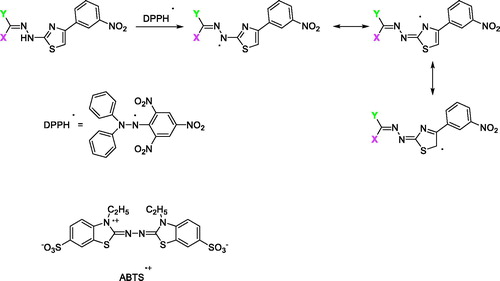
Figure 5. Glide top poses of compounds (a) 3, (b) 4, (c) 13, and (d) 37 in the hMAO-B active site. Ligands are depicted in orange carbon polytube, the FAD is shown in lilac coloured CPK and the most relevant residues are reported in lilac carbon polytube. Hydrogen bonds, cation–π and π–π interactions are displayed in yellow, green and light blue respectively.
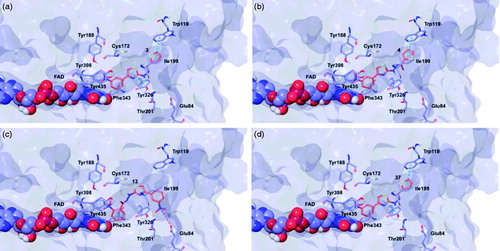
Figure 6. Glide top poses of compounds (a) 3, (b) 4, (c) 13, and (d) 37 in the hMAO-A active site. Ligands are depicted in orange carbon polytube, the FAD is shown in lilac coloured CPK and the most relevant residues are reported in lilac carbon polytube. Hydrogen bonds, cation–π and π–π interactions are displayed in yellow, green and light blue respectively.
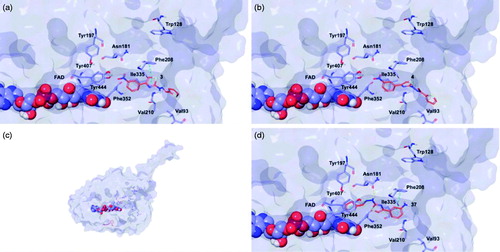
Figure 7. Glide top poses of compounds (a) 3, (b) 4, (c) 13, and (d) 37 in the hAChE active site. Ligands are reported in orange carbon polytube and the most relevant residues are shown in green carbon polytube. Hydrogen bonds, cation–π and π–π interactions are displayed in yellow, green and light blue, respectively.
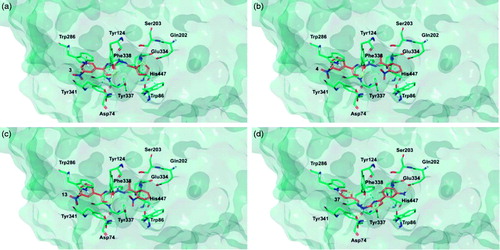
Figure 8. Glide top poses of compounds (a) 3, (b) 4, (c) 13, and (d) 37 in the hBuChE active site. Ligands are reported in orange carbon polytube and the most relevant residues are shown in green carbon polytube. Hydrogen bonds, cation–π and π–π interactions are displayed in yellow, green and light blue, respectively.
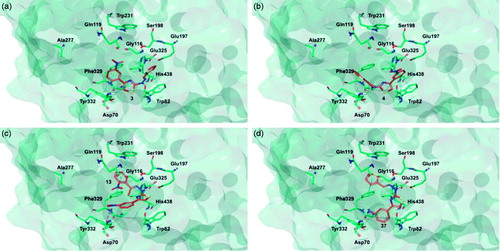
Table 4. Theoretical properties and docking scores of the most interesting compounds for binding to the hMAOs and hChEs.