
Figures & data
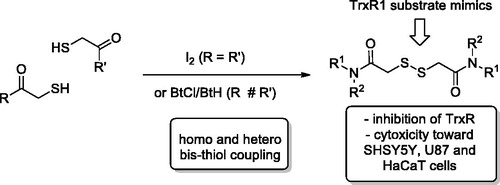
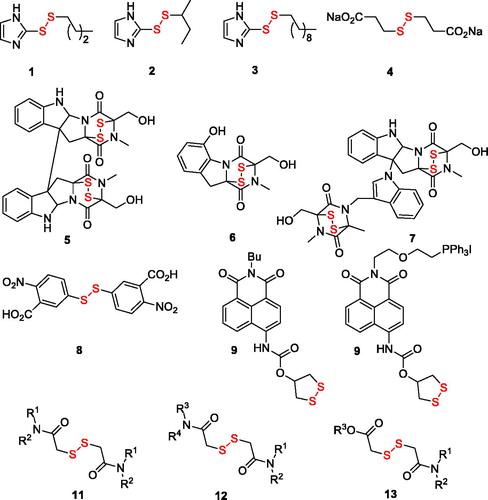
Figure 1. Known disulphide TrxR inhibitors (1–7) and fluorescent probes (8–10) as well as compounds explored in this work (11–13).
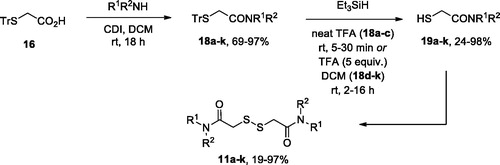
Scheme 1. Preparation of symmetric disulphides 11a–k.
Scheme 2. Preparation of non-symmetric disulphides 12(13)a.
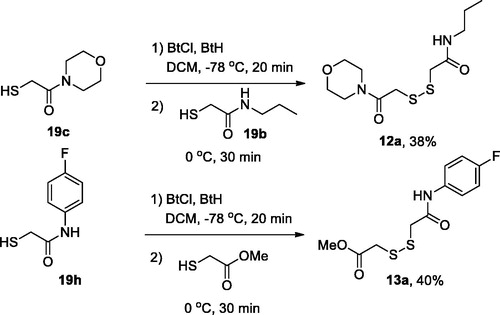
Table 1. Inhibition profile of compounds prepared in this work against TrxR1 measured in neuroblastoma (SHSY5Y) and hepatocyte lysates; cytotoxicity profile of selected compounds determined against SHSY5Y, U87, and HaCaT cells.
Supplemental material