Figures & data
Figure 1. Chemical structures of isolated compounds (1–39) from T. hemsleyanum (Glc: glucosyl; Rha: Rhamnosyl. The configurations of all the sugar residues in the glycosides were determined as β-D with 1H NMR).
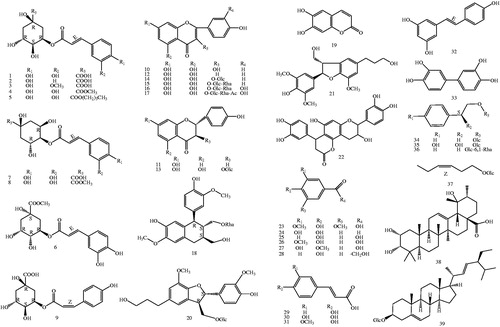
Figure 2. Isolation process diagram of compounds (1–39) from T. hemsleyanum.
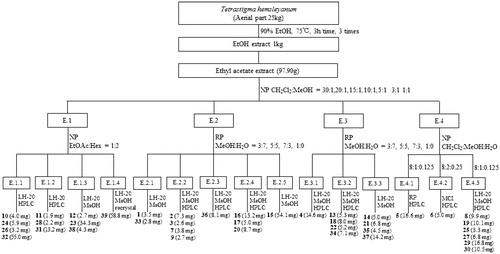
Table 1. Inhibition and IC50 values of compounds (1–39) on sEHa.
Figure 3. Study of binding mechanism between compounds 8, 10, 12, 19 and sEH: Dixon plots for compounds 8 (A), 10 (B), 12 (C) and 19 (D), respectively. Lineweaver–Burk plots for compounds 8 (E), 10 (F), 12 (G) and 19 (H), respectively. Data are the mean of three experiments carried out in triplicate and were determined by one-way analysis of variance followed by Dunnett’s multiple comparison test, p < .05 versus control.
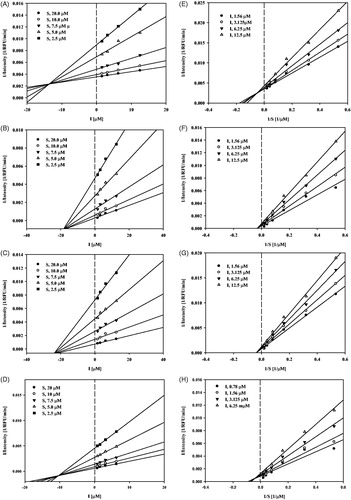
Table 2. Inhibition of NO production in macrophage RAW264.7 cells by compounds 1–39a.
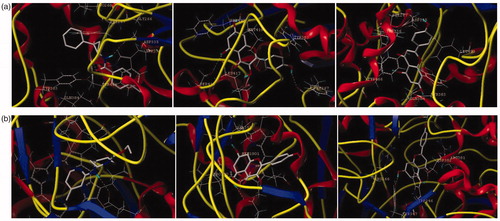
Figure 4. The binding model of compounds 10 and 12 in complex with sEH and iNOS. (a) The proposed binding mode and interaction of molecular modelling between sEH and A/S38_601, compounds 10 and 12. (b) The proposed binding mode and interaction of molecular modelling between iNOS and AT2_1906, compounds 10 and 12. The compounds and important amino acids in the binding pockets are shown in stick model, whereas sEH is depicted in the ribbon model.