
Figures & data
Figure 1. Structures of potent dual EGFR and VEGFR-2 inhibitors.
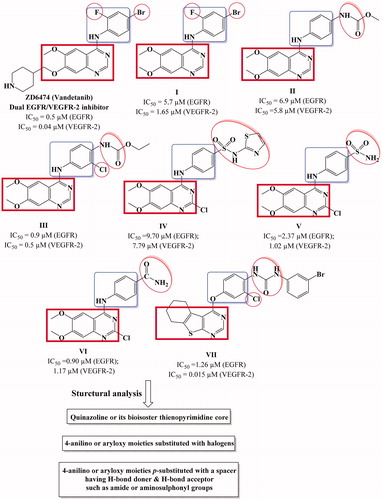
Figure 2. Design strategy of the targeted thieno[2,3-d]pyrimidines derivatives as dual EGFR and VEGFR-2 inhibitors.
![Figure 2. Design strategy of the targeted thieno[2,3-d]pyrimidines derivatives as dual EGFR and VEGFR-2 inhibitors.](/cms/asset/0b3fc921-9b23-4b7d-b7a5-a034f13a3f5f/ienz_a_1593160_f0002_c.jpg)
Figure 3. The synthetic pathway and reagents for the preparation of the target compounds 4a–c and 5a–k.
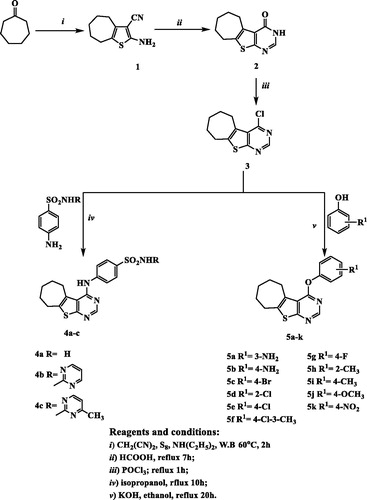
Figure 4. Graphical representation of IC50 expressed in µM of test compounds against MCF-7 cell line compared to doxorubicin and erlotinib.
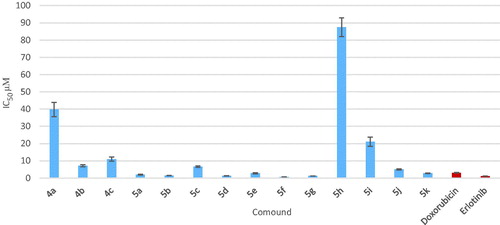
Table 1. Results of in vitro anticancer activity of the newly synthesized compounds 4a–c and 5a–k against MCF-7 cell line.
Figure 5. Graphical representation for IC50 of EGFR assay in µM of compounds 5a, 5b, 5d–g and 5k.
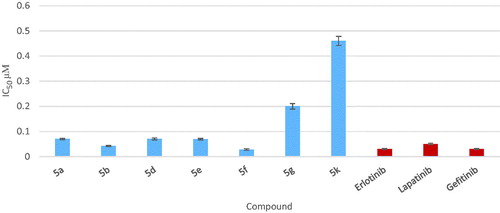
Table 2. Results of in vitro EGFR kinase activity of compounds 5a, 5b, 5d–g and 5k.
Figure 6. Graphical representation for IC50 of VEGFR-2 assay in µM of compounds 5a, 5b and 5d–f.
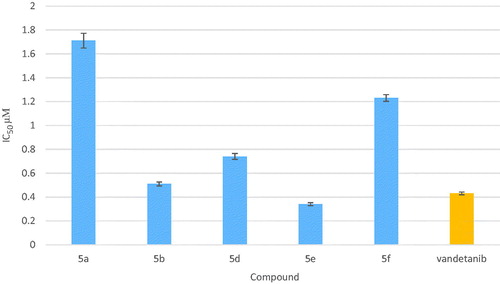
Table 3. Results of in vitro VEGFR-2 kinase activity of compounds 5a, 5b and 5d–f.
Figure 7. (A) Superposition of 5b (green) with erlotinib (magenta) inside the EGFR tyrosine kinase ATP-binding site. (B) Superposition of 5f (pink) with erlotinib (magenta) inside the EGFR tyrosine kinase ATP-binding site. (C) Binding interactions of 5b (green) with EGFR showing good binding energy score value (score: −10.13). (D) Binding interactions of 5f (pink) with EGFR showing the best binding energy score value (score: −10.51).
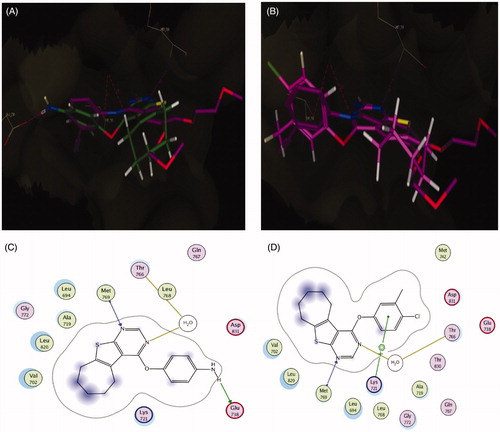
Figure 8. (A) Superposition of vandetanib (orange) with tivozanib (blue) inside the VEGFR-2 tyrosine kinase ATP-binding site. (B) Superposition of 5b (green) with tivozanib (blue) inside the VEGFR-2 tyrosine kinase ATP-binding site. (C) Superposition of 5f (pink) with tivozanib (blue) inside the VEGFR-2 tyrosine kinase ATP-binding site. (D) 2D binding interactions of vandetanib (orange) with EGFR showing the best binding energy score value (score: −18.48). (E) 2D binding interactions of 5b (green) with VEGFR-2 showing good binding energy score value (score: −12.02). (F) 2D binding interactions of 5f (pink) with EGFR showing the best binding energy score value (score: −12.90).
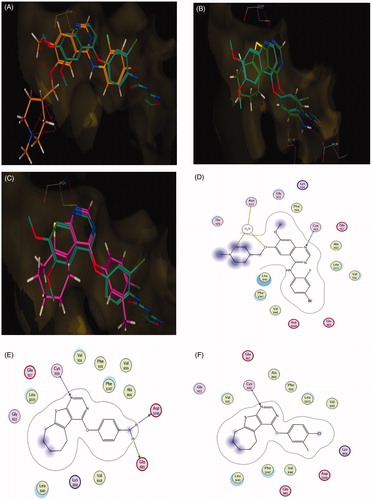
Figure 9. Effect of compound 5f (0.66 μM) on DNA-ploidy flow cytometric analysis of MCF-7 cells after 24 h.
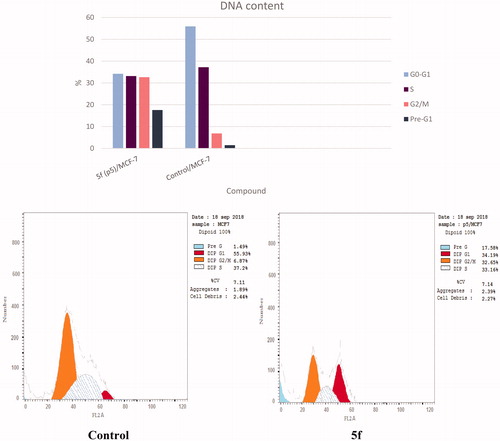
Table 4. Results of cell cycle inhibition activity of compound 5f.
Figure 10. Representative dot plots of MCF-7 cells treated with 5f (0.66 μM) for 24 h and analyzed by flow cytometry after double staining of the cells with annexin-V FITC and PI.
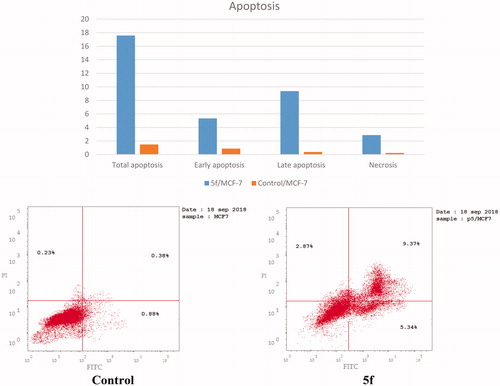
Table 5. Results of apoptotic activity of compound 5f.