Figures & data
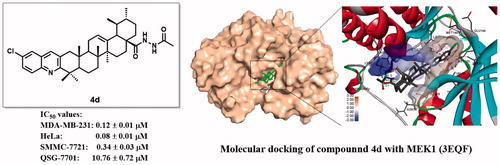
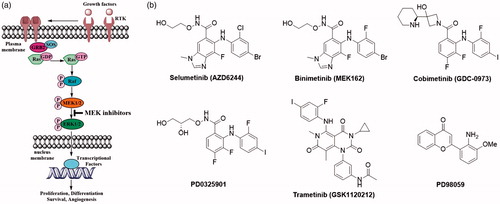
Figure 1. (a) A concise diagram of MAPK signalling pathway. (b) Examples of MEK kinase inhibitors.
Scheme 1. Synthetic procedure to target compounds 4a–h, 5a–h, and 6a–h from ursolic acid. Reagents and conditions: (a) Jones reagent, acetone, 0 °C, 5 h; (b) EtOH, substituted o-amino benzaldehyde, KOH, reflux under N2 atmosphere for 24 h; (c) i. SOCl2, benzene, reflux for 3 h; ii. RCONHNH2, Et3N, CH2Cl2/ether, rt, 8 ∼ 12 h; (d) TsOH, toluene, reflux for 6 h; (e) Lawesson reagent, toluene, 110 °C, 6 h.
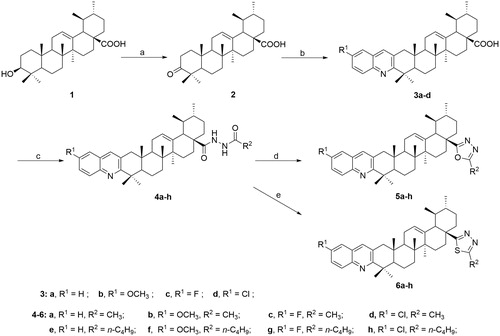
Table 1. The in vitro cytotoxic activities of the tested compounds (1–2, 3a–d, 4a–h, 5a–h, and 6a–h) against three human cancer cell lines (SMMC-7721, MDA-MB-231, and HeLa) and one normal hepatocyte cell line (QSG-7701).
Figure 2. Annexin V-FITC/PI dual staining assay. HeLa cells were treated with different concentrations of compound 4d (0, 0.05, 0.1, and 0.2 μM) for 48 h, stained with Annexin V-FITC/PI and analysed for apoptosis using flow cytometer. The percentage of cells positive for AV and/or PI is reported in the quadrants. Cells in the lower left quadrant (AV–/PI–): live cells; Lower right quadrant (AV+/PI–): early apoptotic cells; Upper right quadrant (AV+/PI+): late apoptotic cells; Upper left quadrant (AV–/PI+): necrotic cells.
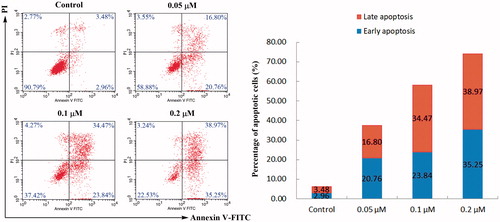
Figure 3. Cell cycle assay. HeLa cells were treated with different concentrations of compound 4d (0, 0.05, 0.1, and 0.2 μM) for 48 h, stained with propidium iodide (PI) and analysed for cell cycle using flow cytometer.
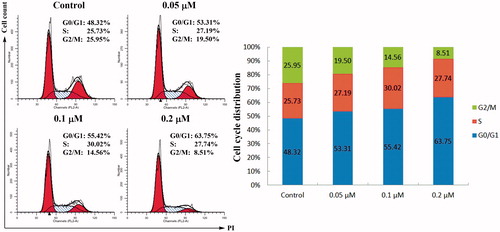
Figure 4. Effects of compound 4d on the intracellular ROS level in HeLa cells. HeLa cells were treated with different concentrations of compound 4d (0, 0.05, 0.1, and 0.2 μM) for 48 h, stained with DCFH-DA and analysed using flow cytometer.
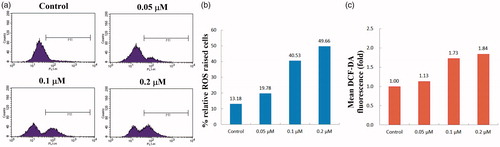
Figure 5. Compound 4d-induced loss of the mitochondrial membrane potential (ΔΨm). HeLa cells were treated with compound 4d (0, 0.05, 0.1, and 0.2 μM) for 24 h, incubated with JC-1 and analysed using flow cytometry.
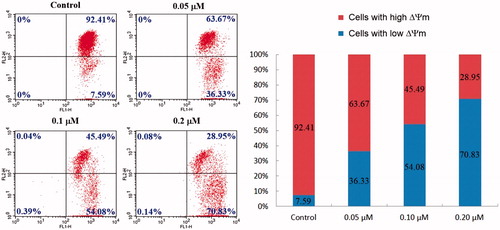
Figure 6. (a) Western blot analysis of the levels of Cytochrome c in cytosol, Bax, Bcl-2, Caspase-3, and Caspase-9 expression in HeLa cells treated by compound 4d (0, 0.1 and 0.2 μM) for 48 h; (b) The rate changes of Bax/Bcl-2 in HeLa cells. *p < .001; (c) The expression level of cleaved caspase-3 in HeLa cells. *p < .001; (d) The expression level of cleaved caspase-9 in HeLa cells. *p < .02; (e) The expression level of Cytochrome c in cytosol of HeLa cells. *p < .01.
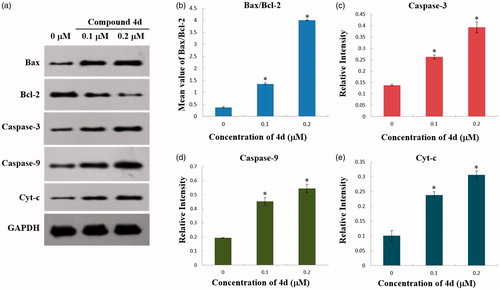
Table 2. MEK1 inhibitory activity of UA derivatives.
Figure 7. (a) Effects of compound 4d on the expression of ERK and pERK in HeLa cells. HeLa cells were treated with compound 4d (0, 0.05, 0.1, and 0.2 μM) for 48 h; (b) The expression level of ERK1/2 in HeLa cells. *p < .001; (c) The expression level of pERK1/2 in HeLa cells. *p < .001.
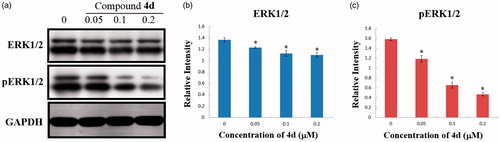
Figure 8. (a) Western blotting analysis of the levels of p90RSK, p-p90RSK, BAD, and BIM expression in HeLa cells treated by compound 4d (0, 0.05, 0.1, and 0.2 μM) for 48 h; (b) The expression level of p90RSK in HeLa cells. *p < .01; (c) The expression level of p-p90RSK in HeLa cells. *p < .001; (d) The expression level of BAD in HeLa cells. *p < .001; (e) The expression level of BIM in HeLa cells. *p < .001.
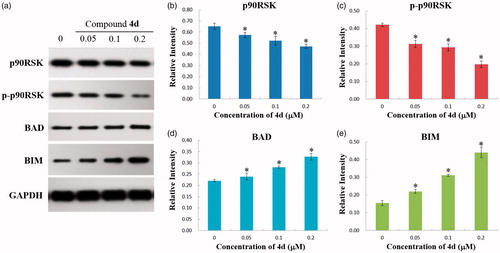
Figure 9. Binding mode of compound 4d at MEK kinase domain (PDB: 3EQF). (a) Molecular structure of compound 4d; (b) Space-filling model of MEK1 protein with compound 4d embedded in the binding pocket; (c) Binding pose of compound 4d within the MEK1 kinase domain. Ligand and key residues are presented as stick models and coloured by atom type, whereas the proteins are represented as ribbons. The colours of the surface indicate the hydrophobicity of the binding pocket. The dash lines exhibit the H-bond and other non-bond interactions; (d) 2D projection drawing of compound 4d docked into MEK1 active site.
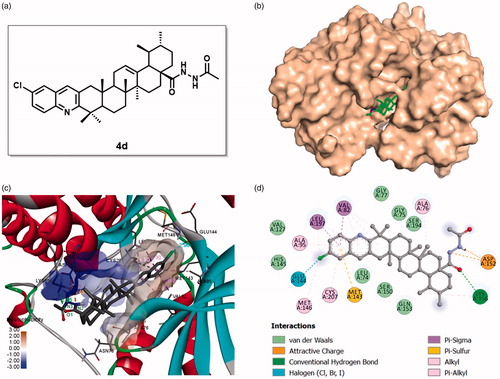
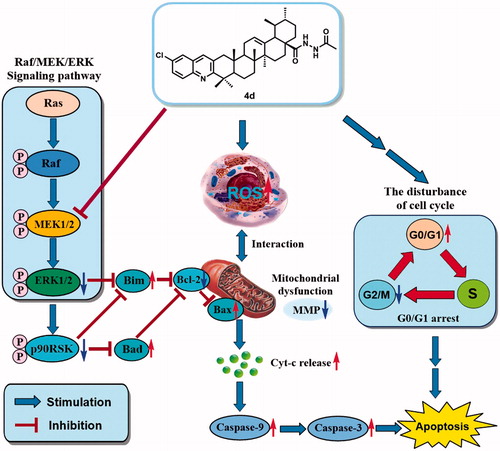
Figure 10. Possible anticancer mechanisms of compound 4d.