
Figures & data
Figure 1. The protein structure of insulinCitation20–22.
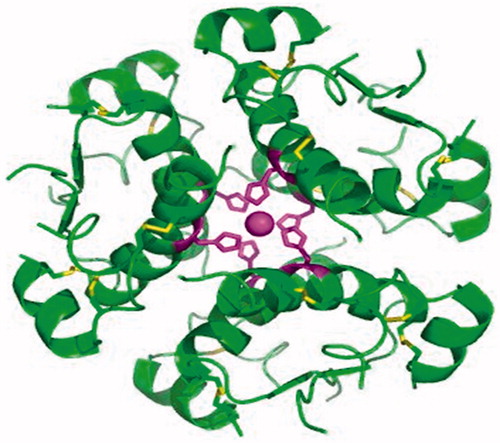
Figure 2. The structure of NIDDM drugs.
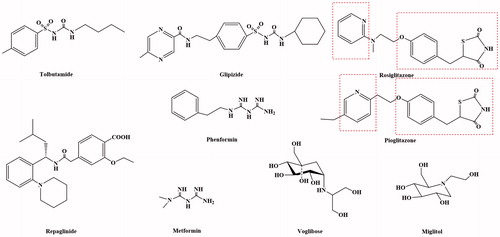
Figure 3. The protein structure of PPARCitation52–58.
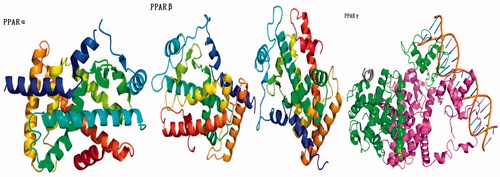
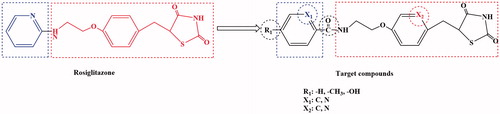
Figure 4. Design of 2,4-thiazolidinedione compounds.
Scheme 1. The synthetic route of 2,4-thiazolidinedione compounds.
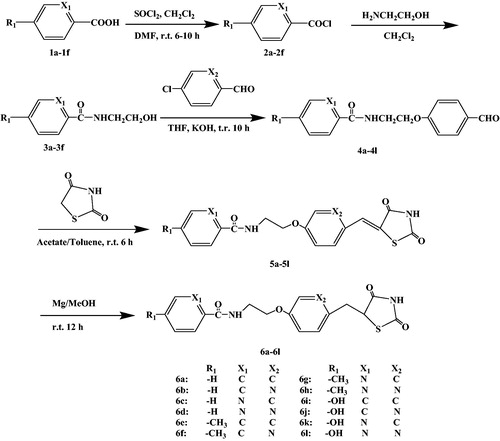
Figure 5. In vitro activities of PPARγ agonists activity.
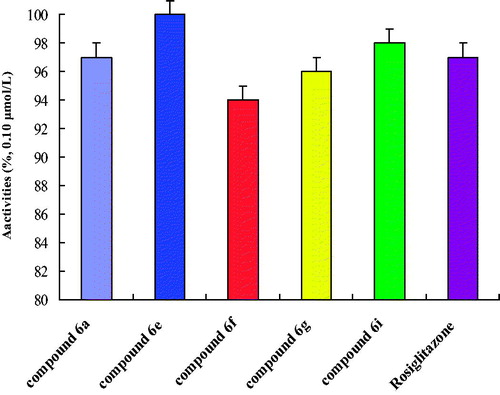
Table 1. In vitro the activation of test compounds on PPARα, PPARβ and PPARγ.
Table 2. The oral glucose tolerance test.
Table 3. The effect of compounds on blood glucose under insulin load.
Table 4. The cytotoxicity and acute toxicity tests.