Figures & data
Figure 1. Examples of dual EGFR/HER2 inhibitors.
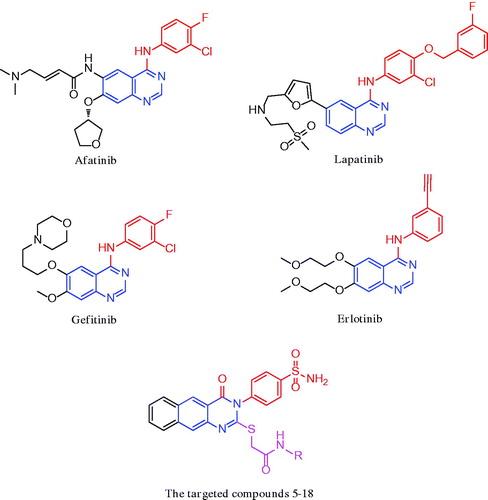
Scheme 1. Synthesis of the benzo[g]quinazolinone derivatives 4–18.
![Scheme 1. Synthesis of the benzo[g]quinazolinone derivatives 4–18.](/cms/asset/75efb37e-3849-40ee-b3ec-aeed85696faa/ienz_a_1609469_sch0001_b.jpg)
Table 1. The cytotoxic activity and percentage inhibition of compounds 5–18 on EGFR against MDA-MB-231 breast cancer cell line.
Table 2. IC50 of compounds 10, 11, 13, 14, and 18 against EGFR and HER2 enzymes.
Table 3. The effect of compound 10 on the level of caspase-3.
Table 4. The effect of compound 10 on Bax/Bcl2 expression levels.
Figure 2. The effect of inhibitors on the phases of the cell cycle (A) compound 10, (B) erlotinib, and (C) control MDA-MB-231 cells.
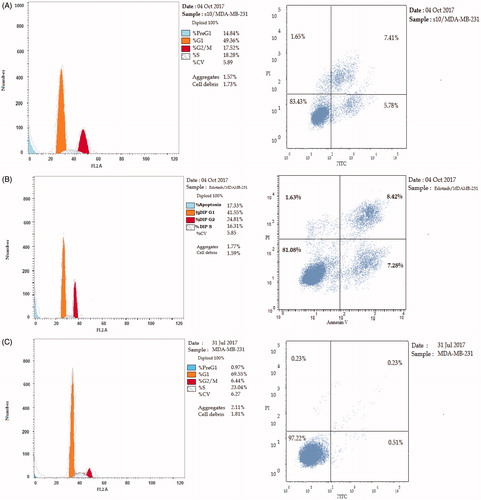
Table 5. The effect of compound 10 and erlotinib on the phases of cell cycle.
Table 6. The cytotoxicity of compound 10 and erlotinib on 184A1 normal breast cells
Table 7. IC50 of compound 10 on MDA-MB-231 cells before and after being subjected to a single dose of 8 Gy γ-radiation.
Figure 3. 2 D and 3 D ligand interactions of erlotinib inside the active site of 1M17.
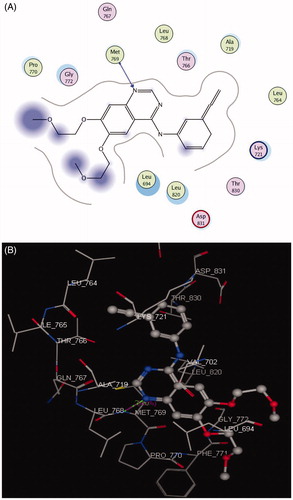
Figure 4. 2 D and 3 D interaction maps of compound 10 inside the active site of 1M17.
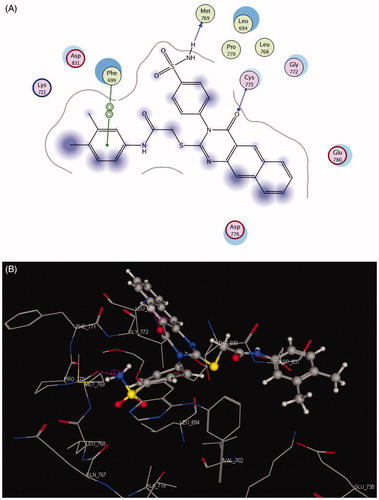
Table 8. Docking results of compound 10 inside 1M17 and 3RCD active sites.
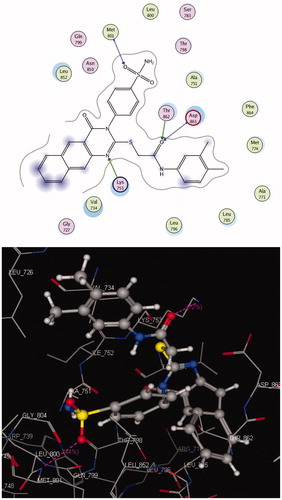
Figure 5. 2 D and 3 D interaction maps of TAK-285 inside the active site of 3RCD.
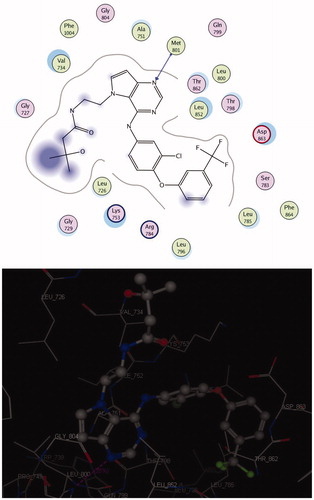
Figure 6. 2 D and 3 D interaction maps of 10 inside the active site of 3RCD.