Figures & data
Figure 1. Chemical structures of natural phenolics tested against ARGLi activity.
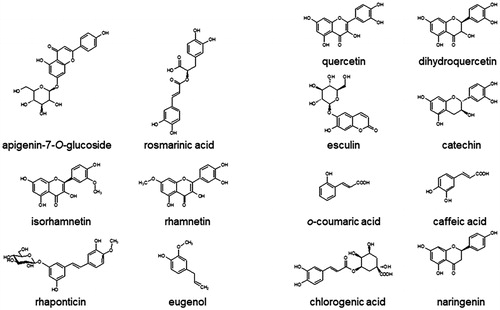
Figure 2. Biochemical characterization of ARGLi. (A) Effect of temperature on ARGLi activity. ARGLi-catalyzed urea production was measured over different temperatures ranging from 5 °C to 85 °C. (B) Effect of pH on ARGLi activity. ARGLi-catalysed urea production was measured over a pH range of 7.0–10.0. MOPS was used as a buffer for pHs 7.0–8.0, while CHES was used for pHs 8.6–10.0. (C) Michaelis–Menten kinetics of ARGLi. Initial velocity was plotted against the concentration of L-arginine. Kinetic parameters (Vmax of 0.28 ± 0.016 mM/min; Km of 5.1 ± 1.1 mM) were determined from the non-linear regression of the Michaelis–Menten curve. Data represent the mean ± SE of three independent measurements.
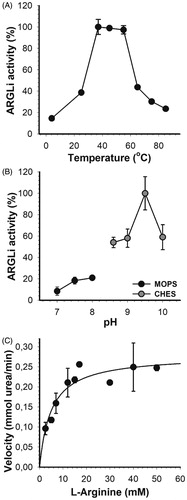
Figure 3. Effect of phenolic substances of natural origin on ARGLi activity. ARGLi-catalysed urea production was measured in the absence (control) and presence of fourteen natural phenolics at 100 μM concentration. Data are shown as percentage of ARGLi activity in relation to the control and represent the mean ± SE of three independent measurements. The dashed line highlights 100% ARGLi activity (control). Arrows indicate rosmarinic acid (71.48 ± 0.85%) and caffeic acid (56.98 ± 5.51%) as potent ARGLi inhibitors.
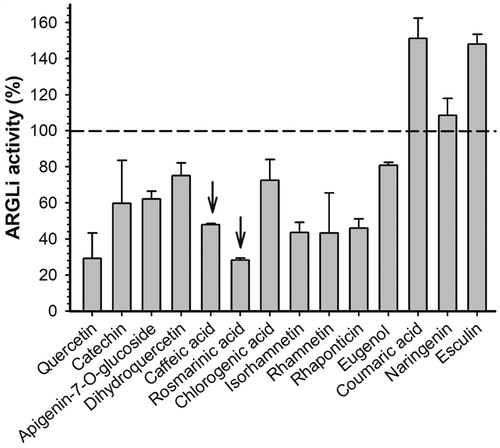
Figure 4. Rosmarinic acid mode of binding to ARGLi active site. (A) Close-up view of rosmarinic acid docked into the active site of ARGLi. ARGLi three-dimensional model is shown in cartoon representation. α-Helices are coloured cyan, β-sheets are coloured magenta, and loops are coloured light pink. The two manganese ions inside ARGLi active site are displayed as green spheres. Residues His140, Ala141, Asp142, Glu198, and Pro259, which directly interact with rosmarinic acid (gray), are displayed in yellow and marked. Hydrogen bonds are represented as green dashed lines. (B) Chemical structure of rosmarinic acid.
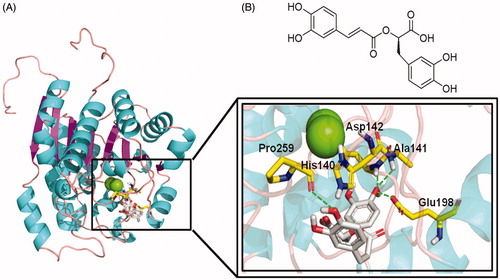
Table 1. Activity of ARGLi inhibitors against RAW 264.7 macrophages (CC50±SE) as well as L. infantum promastigotes and intracellular amastigotes (IC50±SE).
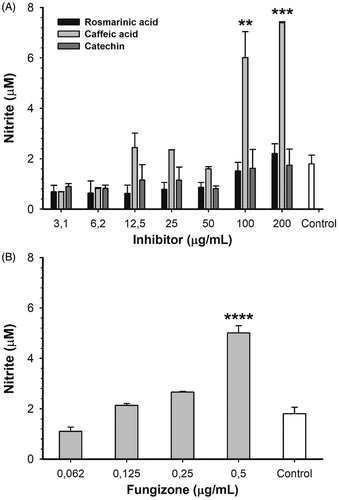
Figure 5. Nitric oxide production by L. infantum-infected RAW 264.7 macrophages treated with different concentrations of ARGLi inhibitors. (A) Treatment with 3.1–200 μg/mL of rosmarinic acid (black), caffeic acid (light gray), and catechin (dark gray). (B) Treatment with 0.062–0.5 μg/mL of the reference drug fungizone. Control (white) represents the production of nitric oxide by infected and untreated macrophages. Nitrite concentration was measured by the Griess reaction and data represent mean ± SE of two independent experiments. Asterisks indicate treatments that were significantly different compared to the control, in which ****p < .0001,***p < .001, and **p < .01.